I’m probably not going to do a full Velocomp AeroPod Review, I would need a wind tunnel handy and other similar products with which to compare AeroPod. Nevertheless, this is one of those products that I am just a little bit too excited about for my own good. After all, we are talking about FREE SPEED. We all love free speed.
 AeroPod Basics
If you are researching a product like AeroPod then I’m assuming you are a member of my A-Team of readers who already mostly know what it is, so I will be brief with the basics.
AeroPod is an opposing force power meter producing watts from air pressure and other information. It can be used just as a power meter, if you like.
 But I’m pretty sure you’ve already got a power meter 😉
As you know, the difference between AeroPod’s calculation of your WATTS and your other PM’s calculation of WATTS can be directly used to give a figure of your aerodynamic drag, or CdA. AeroPod directly links to your existing power meter to produce this live & averaged CdA figure itself, then broadcasts the results over ANT+.
My understanding is that the determination of CdA was also possible with the earlier Velocomp PowerPod product, albeit through more convoluted means and only after the ride had finished.
Velocomp now has a CIQ Data Field to display live CdA data on your high-spec Garmin. The CIQ data field is currently available to download and install manually (not through Garmin Express). Once an ANT+ standard is finalised then Velocomp will rewrite the data field and distribute it in the normal way through the CIQ store.
What’s New?
Quite a lot has changed since the previous PowerPod product.
- Improved wind sensor
- Improved accelerometer
- New Pilot Tube design improves wind measurement, including in crosswinds
- Faster microprocessor with more memory
- Redesign of the calibration procedure
- Improved auto-calibration at the start of the ride (90 seconds, vs 8 minutes previously)
- CdA measurement is enabled
- Transmits CdA, wind, slope, and Time Advantage over ANT+
- Powerstroke, GPS Tracker and BLE compatibility are standard
- Complete redesign of the product case
- New mount accessory for “aero-shaped” bars
- Calibration ride files no longer recorded to avoid confusion
Installation
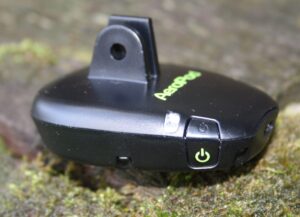
Bits & Pieces
Here’s what you get.

- A DFPM is required for CdA data.
- You also NEED a wheel-based ANT+ speed sensor.
- A cadence sensor is not required for CdA (but required for PowerStroke measurement)
- A HRM can be paired to AeroPod but this is NOT RECOMMENDED
Physical Installation of AeroPod on your bike
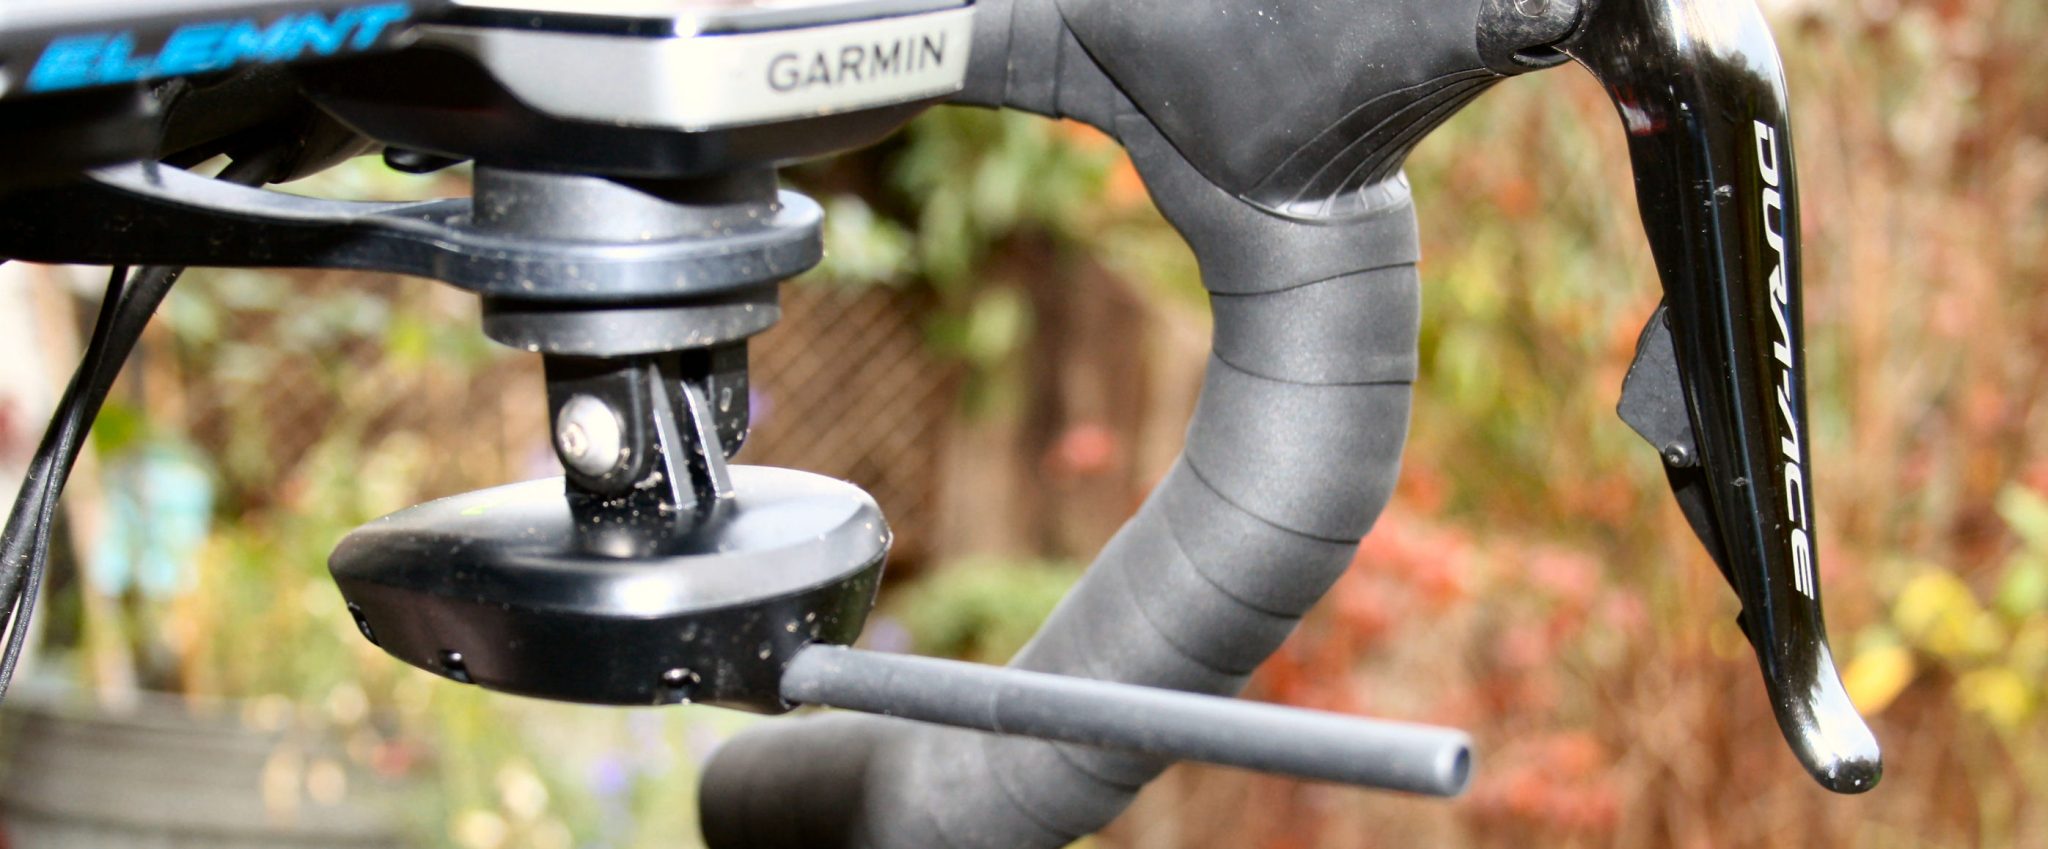
The physical installation onto your bike is quick and simple and requires a rigid, metal mount. I used one of Velcomp’s out-front, Garmin-compatible mounts and there are TT mounts as well.
The nature of the sensor tube that sticks out ahead of the AeroPod resolves one of the issues with Velocomp’s earlier products, the PowerPod. IE it avoids potential disruption of the airflow measured by the sensor because of cabling – I had that problem before when using powerpod on my road bike.
The only special thing you need to do is to ensure that the tube points very slightly downwards. The mount limits how far the tube can be pointed downwards. So, push it all the way down.
Make sure everything is tight then you are good to move to the next step.


Pairing all the sensors
You will need an ANT+ speed sensor and a calibrated ANT+ power meter (DFPM) for the CdA data.
I used a Wahoo SPEED sensor on the front wheel and I had ASSIOMA DUO pedals.
A crank-mounted cadence sensor can optionally provide pedal stroke information. I didn’t use one as the cadence data was picked up from my PM and it’s not required in any case.
A HRM can also be paired to the AeroPod after the calibration but I didn’t specifically do that. Yet somehow my HRM seems to have silently paired to the AeroPod (??). Pairing a HRM affects what data is recorded and the presentation of CdA data later, so you do NOT want to pair a HRM now, make sure you do not have a HRM nearby when pairing.

Pairing Procedure & Details: I won’t cover the info that is supplied elsewhere with the product and online in the AeroPod Forum. The end goal is to end up with your AeroPod as the paired and active PM on your Garmin but you WILL need to follow the instructions to the letter.
Problems: I had some problems pairing devices which I attribute to a) being in a room full of other ANT+ sensors [tip: do pairing in a room that is NOT full of ANT+ sensors!] and b) my Wahoo speed sensor turning itself off too quickly [Grrrr]. Generally pairing should ‘just work’ but, if it doesn’t, then the LED info and recovery steps were not obvious.
Problems: As I discovered later, Wahoo speed sensors can have multiple, repeated dropouts from the speed sensor. This is a Wahoo issue.
Trouble Shooting Setup: Try the video above or > this document <
 Setting Up The Garmin
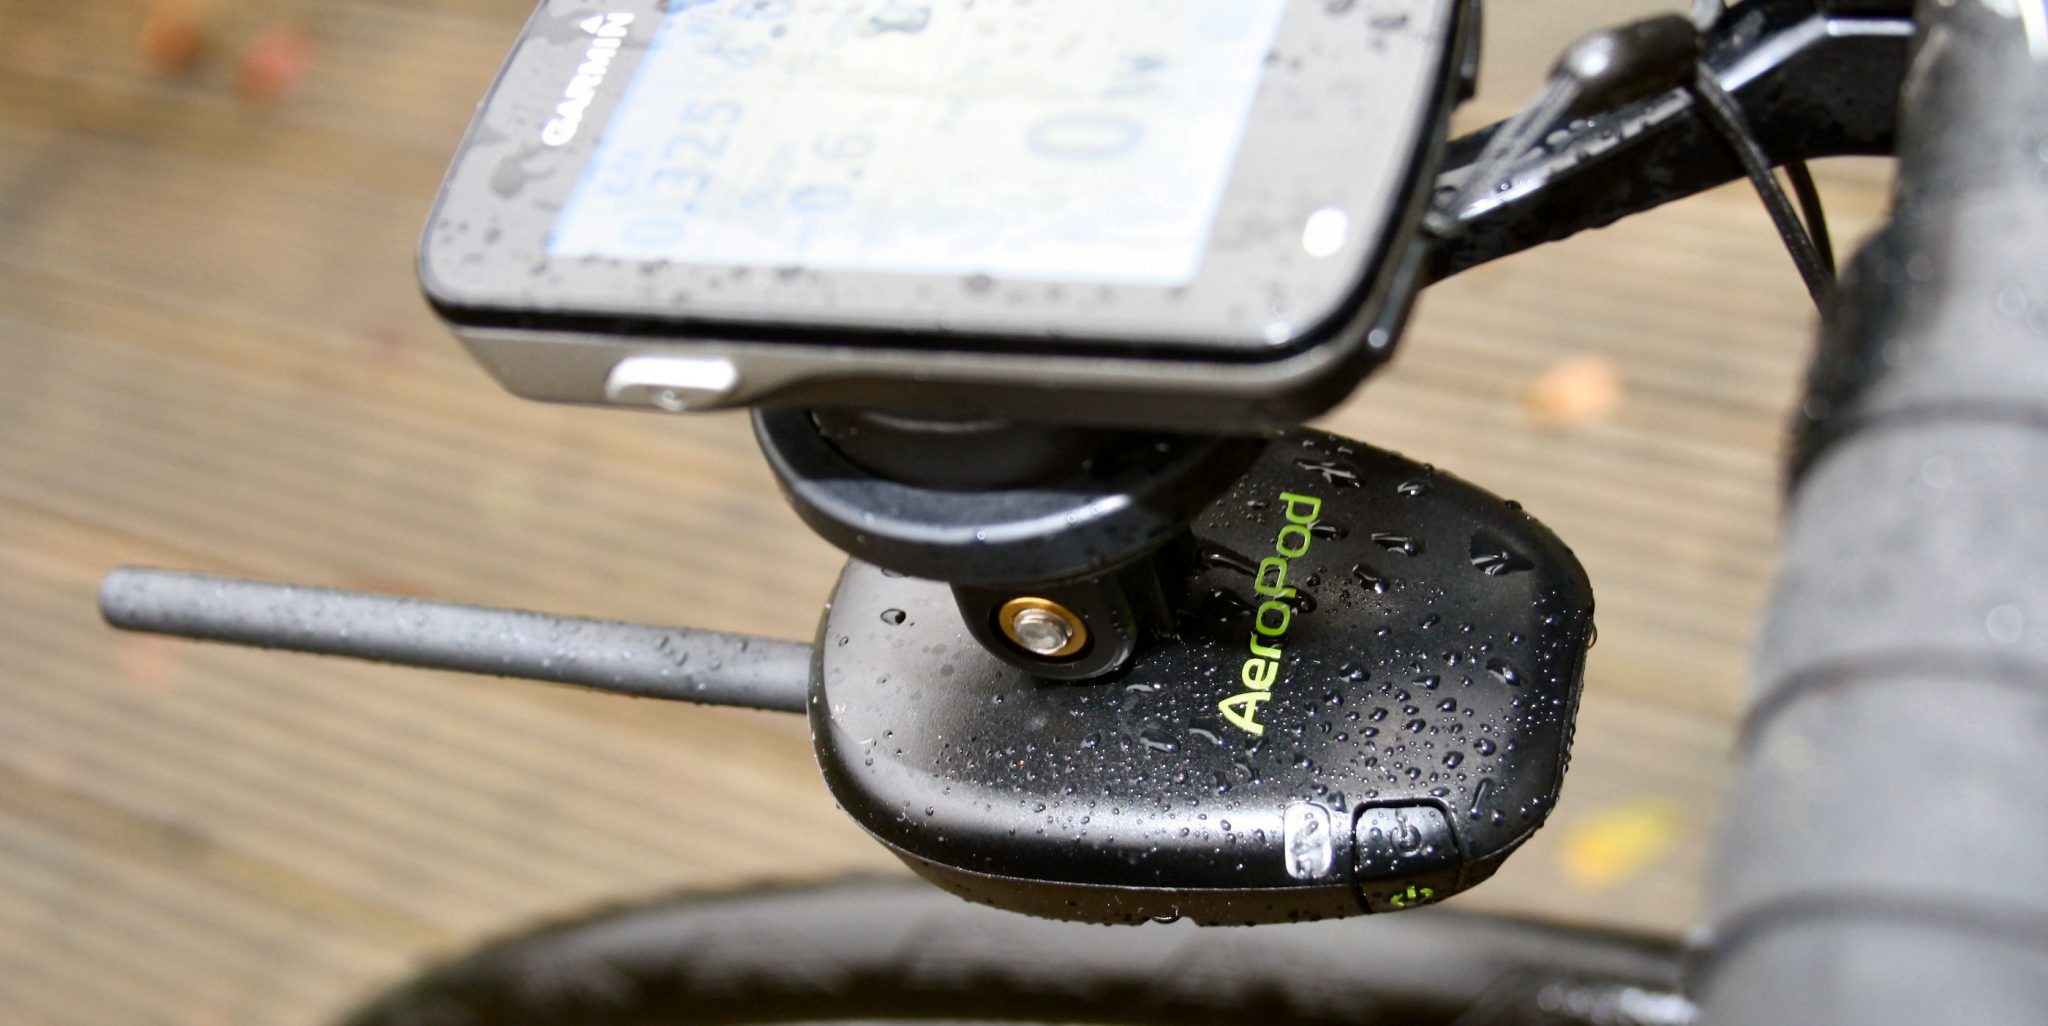
I created a 2-field page for CdA testing on my Edge 820.
I had my regular 3s power field at the bottom of the screen plus the CIQ field from Velocomp at the top. The Velocomp data field is a single field that contains and displays multiple bits of data, namely; CdA, wind speed (mph), Slope (%) and Time Advantage (sec) ie Velocomp’s CIQ field looks like 4 data fields…but isn’t.
Note: AeroPod receives speed from a speed sensor, the cadence from cadence sensor or DFPM, DFPM power and HR. It also receives a ‘lap’ marker from your Garmin.
Note: AeroPod transmits DFPM power, CdA, wind speed, time advantage and slope data
Calibration Ride
This takes 5-10 minutes with an out-and-back ride.
For the calibration ride, the AeroPod temporarily takes over the WATTs figure, changing it to a progress %age (even though it still says, Watts). At 50% into the calibration ride, you turn around and head back and then keep going past the start point.
You will need to be in your normal position and will want to be going at a reasonable or ‘normal’ speed (>=17mph). This calibration ride will produce your baseline CdA which is then used later to let you know if new riding positions or kit are better than the baseline.
Riding
Ride & Testing Basics
The AeroPod is the only paired & active power meter on your Garmin.
Spin the wheel with the speed sensor on and activate your calibrated PM. Briefly press the AeroPod button and watch it turn from flashing green to solid green. You know what solid green means…GO!
 The AeroPod itself pairs to your regular PM (DFPM) and re-broadcasts the DFPM data to your Garmin ie DFPM data appears to come from AeroPod. I found there to be a slight lag in the display of Watts from the AeroPod when I compared it to directly to the watts on my ELEMNT. I initially assumed that the AeroPod transmitted its own calculation of power from opposing forces – but it doesn’t.
The CdA figure that was on display did not adapt to my position as quickly as I expected and takes several 10s of seconds. My understanding is that there is a 90 second averaging period used by AeroPod and that it is further recommended that you perform any one test for at least 3 minutes at the very least to get meaningful figures.
It would seem sensible that you would want to perform any tests in a scenario as close as possible to this: flat road (<3% grade); smooth road; >5 minutes long ride; no wind or, at least, consistent wind; no traffic; and at the same power level – that’s tricky if you live in London.
The CIQ data field is currently a display-only field. ie none of the AeroPod data is written back into the FIT file recorded by your Garmin.
Press ‘lap’ on your Garmin and that ‘lap’ is also sent to the AeroPod and recorded on the AeroPod. This just places a ‘marker’ in the file so you do not have to do it. However, later analysis is made easier if you press ‘lap’ during your ride. Alternatively, you could physically start and stop at the end of each test (which you will often do in any case to adjust or change your kit) and then the zero pedalling/zero watts in the file at the end will mark the tests just like a lap would.
I don’t think it makes that much difference if you wait until you are ‘up to speed’ and ‘in position’ before pressing the ‘lap’ button.
Data Analysis
Currently, your data analysis will be in Velocomp’s Isaac software (v4.1.1). Version 5 is due soon which offers similar analytical functionality to v4 but adds new device maintenance options eg the ability to update AeroPod Firmware.
Isaac is essential to analysis, at least until CdA data becomes integrated into the FIT File/ANT+ standard.
The main areas you will use Isaac for will be 1) data manipulation & 2) CdA analysis
Data Manipulation
It’s likely you will want to combine your Garmin FIT file with your AeroPod IBR file. Here’s what I did (by no means is all of this necessary)
- Loaded the IBR file directly into Isaac, using the USB cable
- Used Fit File Repair Tool to correct the elevation track on the Garmin’s FIT file
- Used Fit File Repair Tool to correct gaps in the speed track from the speed sensor using GPS points
- Used Fit File Repair Tool to convert Garmin’s FIT file to a TCX file (Garmin Connect can also do this)
- Loaded the TCX file into Isaac, overwriting speed, DFPM power and elevation
At the end of the manipulation you get a fairly straightforward ride chart with info as shown below (and more metrics, not shown). The only unusual part of this chart is the white ‘speed’ line in the top graph. The blue vertical lines, image below, indicate the extent of the tailwind or if the blue lines go up, the headwind. No CdA info is shown at this stage. (Although that’s technically not true, if no HRM is paired then the HR graph will show CdA)

CdA Analysis
- Using Isaac, I manually added laps in my first ride to visually help identify my ‘tests’ as I did not press ‘lap’.
- Tools > CdA Analysis is where the analysis is done. And you can get a chart like this

- The lap markers are merely guides for you. After you select a range as shown with the vertical blue bar then the CdA for that period appears in the top left-hand corner (0.324 is shown above)
- Other measures are displayed as separate graphs, for example, I included the TIME ADVANTAGE chart which shows how much time your current position/kit combination saved or lost compared to your baseline.
- The results from my first ride’s worth of tests are further below
General Thoughts on Realistic Goals
So, that is the overview of the process you go through. You can test for the effects of changes to position or changes due to new kit like tighter clothing or decent wheels or a silly helmet (I have one). If you have the correct baseline configuration on one bike then you should not have to do a ‘straw man’ ride or calibration each time to set an idea of your base position, you just go with the new kit and see what happens. You can calibrate each time if you want to but calibration is really for when you switch your AeroPod onto a new bike (different bike profiles can be stored, not tested)
Your ultimate, end goal from looking at the aerodynamics of your position may not be what you imagine. For example, you might find a super-efficient aero position but only be able to hold it effectively for a minute…and that’s clearly not going to be of any use for endurance athletes. OK, you can train yourself into a certain position to a certain degree but ultimately, just like with your bike fit, you are most normally going to be targeting some sort of ‘optimal’ or ‘trade-off’ position.
Similarly, you might find that going from HOODS to DROPS might only be very slightly more aero for you on your road bike. Then you have to question whether or not it is worth doing that when comfort and sustainability are taken into account.
Nevertheless, almost everyone who has got this far will just know that they are HEAPS faster on their TT bike compared to their road bike even though, to some, it may be uncomfortable. We all know those aero savings are huge. So if you don’t really buy into aero gains then now is the time to see for yourself, borrow a TT bike and don your tightest lycra and perhaps borrow a friend’s silly helmet. THEN come back and buy an Aeropod 😉
First Ride – Some Details
My ultimate personal goals are twofold 1) fine-tune what I think is already a good oly-distance TT position 2) discover more substantial road bike aero improvements building on an inefficient position that I chose only because it keeps me injury-free. Although technically, I guess that makes it efficient…you know what I mean.
But today’s first ride was more about proving it all works and getting something at least vaguely meaningful to write about here.
I repeated an out-and-back ride with a notable pause before each out and each back. I waited for traffic to clear and make any kit adjustments that might have been necessary. Plus I obviously waited for anyone who might possibly overtake me to go through first 😉 I chose a 2km stretch between Roehampton Gate and Robin Hood Gate in Richmond Park, it’s recently resurfaced and mostly flat with little traffic. I went at a sub-FTP pace somewhere between moderately hard and hard -so that I could repeat it evenly about 10 times.
Kit: Cervelo S3, Shimano C60 (50mm rim) aero wheels, Specialized Evade aero ROAD helmet. Edge 820 +others. The bike fit is a ‘comfort fit’ and not aggressive.
 Each run was about 3-4 minutes long and, I later found out that this is really too short and its best to do a 5 to 6-minute ride. However, as I had done an out and back in the same position then 2 lots of 3-4 minutes was actually pretty sensible to use.
Here are the run conditions and the resulting CdA values
- Run 1 & 2: on the bars – super inefficient (.411 & .369)
- Run 3 & 4: cruising on the hoods, sustainable position for hours (error & .400)
- Run 5 & 6 – aggressive on the hoods, forearms near horizontal. Sustainable but not for more than an hour or two. (.396 & .346)
- Run 7 & 8 – drops, sustainable and relatively comfortable position for over an hour (.331 & .368)
- Run 9 & 10 – drops, aggressive with all superfluous bits of bike kit removed, no gloves, zip pulled right up and with goggles. Conscious effort to get low and keep elbows in. Perhaps sustainable for 10-20 minutes at higher power levels. (.323 & .326)
Clearly, the drag figures are improving as the tests progress and it’s a shame run 3 didn’t work out. But, so what? Do I train to maintain that really aggressive position? Or do I buy some more, even tighter, lycra?
Let’s refer back to the ride chart from above (repeated, below)
- Going from left to right, over time, I adopted increasingly more aero positions and the blue TimeAdv chart at the bottom shows the increasing amount of time I save in this position compared to my baseline positions. The Time Advantage chart could be improved but its clarity is perhaps not helped with there being a slight problem with my calibration ride which impacts this chart.
I won’t explain it any more but the chart is ‘indicative’. To me, this chart shows that I DO gain perhaps 15-20 seconds by going on to the drops compared to an aggressive ‘hoods’ position ON THIS RIDE. Adopting an even more aggressive drops position also make a notable difference but it is in a position that I really can’t maintain on the kinds of long rides I do with this bike.
Second Ride
My second ride was 2x 30-minute routes trying to assess an aggressive hoods position vs my preferred/comfortable drops position.
- First Test (Comfortable Drops) – 34:34 minutes CdA – 0.445
- Second Test (Aggressive Hoods) – 33:32 minutes CdA – 0.433
Traffic conditions varied quite a bit from one ride to the next, although a good 30 minutes of each ride was traffic free.
I moved the tilt of the AeroPod slightly before the ride. That may invalidate the results and may have made the CdA much higher than on the initial calibration.
The results were inconclusive. But they have prompted me to check again whether or not it is worth me riding on the drops for this type of ride.
Aero Savings – aka Free Speed
Source: Garmin.com
- Bike commuter: 0.600 m2
- Road bike cyclist: 0.350 m2
- Amateur time trialist: 0.290 m2
- Elite time trialist: 0.220 m2
- Elite track pursuiter: 0.200 m2
Typical Time Savings with optimised Aero Position
- 20 km race : 32 secs
- Olympic distance Tri 40 km : 64 secs
- Ironman distance 180 km : 270 secs
Other Points & FAQs
- Usage in a velodrome would provide even better conditions
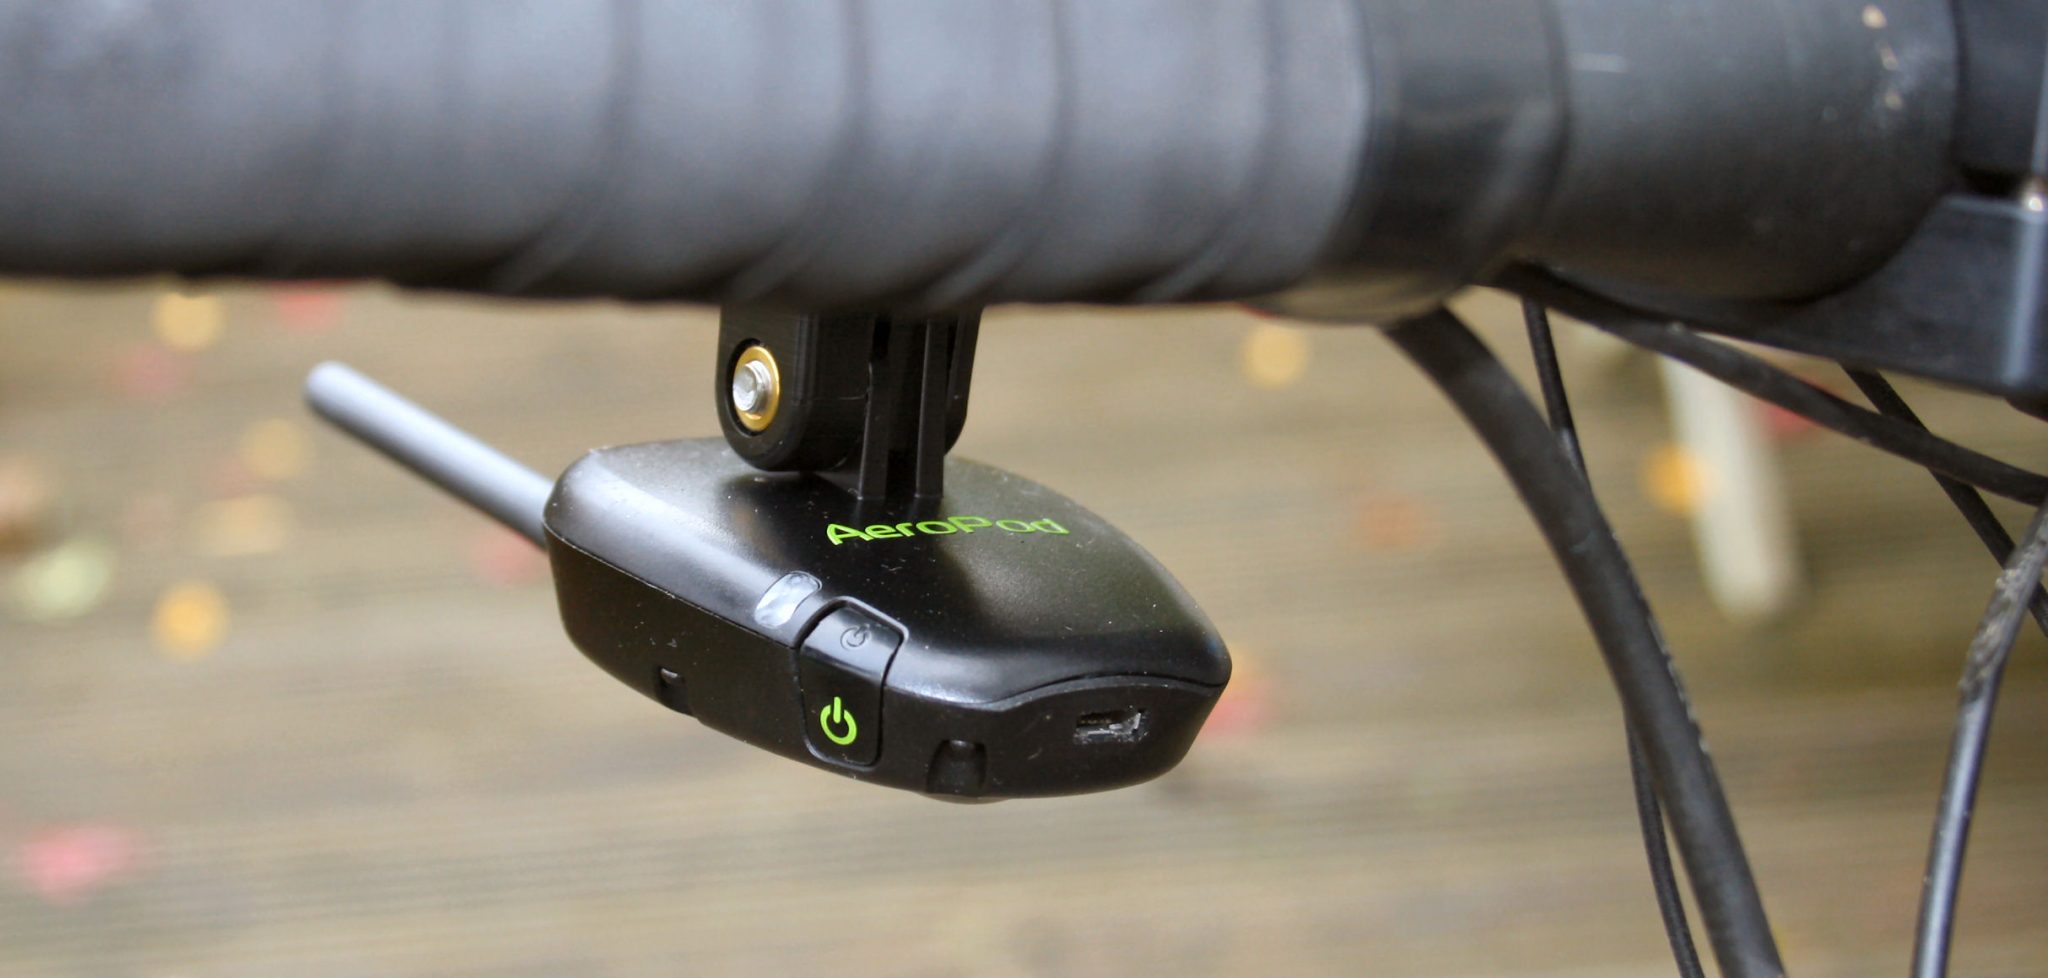
- What do the LEDs mean? Answer: link to velocompforum.com
- Reset AeroPod: Press button and hold it continuously for 12 seconds (not 4)
- Velocomp/Isaac PedalStroke information is not available from the cadence supplied by your power meter.
- Wind angle is not measured
- Currently, until the ANT+ CdA standard is finalised, live CdA is written to the heart rate field. If a HRM is present and paired then, instead, HR will be recorded
- This might be a useful tool to see the effects of drafting in group riding. I’ll have to think about that a bit more.
- Why AeroPod? – the main benefit of AeroPod over the competition is that you can actually buy it NOW. We will probably see over 5 products hit the market throughout 2019, maybe more. I suspect that CdA products have limited markets namely; coaches, enthusiasts and professionals. The enthusiast market must be more price sensitive and AeroPod, to me, seems to be coming in at a sensible level.
- Will the PRO market be ‘more accurate’? I’ve no idea. I’d imagine other products will be generally more expensive and soon price themselves out of any kind of volume business.
- Velocomp state two specific benefits: they have fundamental patents with aspects of this technology (and indeed licence some to competitors already). Their product can also be used as a transportable, 2nd power meter for you to swap between rides (a valid point but with a limited number of users)
Take Out
- Setup and Calibration – Could be simplified
- Ride usage – Generally good
- Analysis – Good and can be improved
- Benefit – Genuine free speed, if you have the time and inclination to test and re-test (FWIW: I do).
Isaac seems a powerful piece of software and it takes a while to get used to it. It’s particularly powerful when used for data manipulation. However, the CdA analysis is slightly more convoluted than I expected and not as central to the ‘experience’ as I would have expected.
I would like to see effort periods automatically identified as laps based on power output (ie without a button press at all). Or, if that’s not possible, then at least a default average of the CdA/Time Average figures should be provided for each lap, perhaps being provided in tabular format. Such a table of results would probably also benefit from an annotation tool where results and test conditions can be explained for future consideration, although there is an existing annotation feature. Maybe that will come with future software versions and, even if not, once CdA standards are agreed, the data will be able to be more readily analysed elsewhere, for those who want to do that. The bottom line is that there clearly is some FREE SPEED to be had, you just have to be willing to invest time into tests and into the AeroPod platform.
- Q: Is it worth it?
- A: Are new, much more expensive, but slightly more aero, wheels worth it?
Price, Availability & Discount
As at 3Dec, AeroPod is currently on sale at $399 at PowerMeterCity (normally $499). When it’s not on sale there is 10% off with my code, as shown below. PowerMeterCity is normally a well priced option.
Reader-Powered Content
 This content is not sponsored. It’s mostly me behind the labour of love which is this site and I appreciate everyone who follows, subscribes or Buys Me A Coffee ❤️ Alternatively please buy the reviewed product from my partners. Thank you! FTC: Affiliate Disclosure: Links pay commission. As an Amazon Associate, I earn from qualifying purchases.
![]()
I think I am going to hold off until Q4 2019 or Q12020 to buy one. I want to see what the competition brings and how they all compare. I love the idea and hope it catches on.
i suspect many competitors will come in more expensive, at least at first.
ant+ standards should simplify things for analysis and reporting but i guess the testing and in-ride experience will be similar with aeropod to what it is now
Want to buy using your code “the5krunner10” but I’m getting an error message “Sorry, this coupon is not applicable to selected products.”. Think you can double check ? Want to support your effort and interested in the 10% discount so hopefully it’s just a mistake from powermetercity ?
Thanks
hi i should get a response back later (it works the smae way for me as for you, just tried). it WAS working last month. I suspect that the 10% no longer works on sale prices. That’s generally true of any manufacturers SALE prices but Velocomp was always an exception.
I think Josh contacted you? yes the 10% is not additional to sale prices
Yes, got the answer.
I’ll probably go for it anyway… it seems the Garmin Aerostick is not coming anytime soon, Notio has a price that make it more a professional tool… so for us mere mortals Aeropod seems like the good compromise 😉
Thanks for trying to get us the best deal possible, wish it had worked with you code… but it’s still a good deal.