Garmin Forerunner – Firstbeat Insights

You get all of this clever stuff from Firstbeat thrown in. And it is clever. I’ll talk about the more interesting features further below in more detail.
Be mindful that optical HR from the wrist might cause issues with the accuracy of the data that Firstbeat has to deal with as might incorrect input data of any sort (power, pace, etc). Any HR data inaccuracies should be rectified by a chest strap and most newish chest straps should also produce HRV data that some of the Firstbeat algorithms like/need in any case.
FWIW I always wear a Garmin HRM-TRI chest strap, the HRM-RUN is perfectly fine if you just run. I also always calibrate my power meters and use a footpod for running pace accuracy.
I’ll talk a bit more about some of these features below and much of this section of the content is co-authored by HB at Firstbeat. ie it should be correct 😉
Forerunner and Real-Time Performance Condition
 Like the analysis behind VO2max, Performance Condition looks at the relationship between your running speed (or cycling power) and heart rate. You are sometimes prompted with your Performance Condition about 5 or 6 minutes into a run but you can also display it continuously as a data metric and/or analyse it afterwards.
Using your VO2max as a baseline, Performance Condition tells you how your current run is stacking up to expectations. Early in your run, your Performance Condition is likely to reflect on your level of recovery or a handful of external factors. As your run progresses, decreases in Performance Condition will likely to match up with the onset of fatigue and your body working harder to keep pace with your fresher self.
Further below we have a long Z2/Z3 hour bike ride (based on power meter data) following a swim. I’m not sure if this is how a Performance Condition chart is meant to be. 4 hours seem to mark a turning point in performance as fatigue sets in.


Here is a different run taken from CONNECT. I’m not sure you can infer anything from it. My performance condition definitley reflected that I started to struggle after about an hour due to a heavy week although my power and HR levels stayed in sync.

- Firstbeat Factette: The first Garmin device with Performance Condition was the Forerunner 630 (2015)
- You might choose to monitor PC during a run or ride and ‘go for it’ when PC values are positive. As the PC figures decline throughout a session then you might get to the point where you curtail the hard stuff.
- When values at the start of a run/ride are more extreme, say +6 or -6, then for me, they clearly reflect my feeling about my own readiness. However, as values hover between +/-2 then I’m not sure I can read too much into the data.
- I usually notice a warming up factor where it takes a while for PC to peak. I’m not so sure it’s meant to do that.
Usefulness?: 7/10. It’s one of those ‘interesting things’ that pops up which you might occasionally take into account as your workout progresses. I haven’t yet got much back from looking at this bit of data trended over a run/ride.
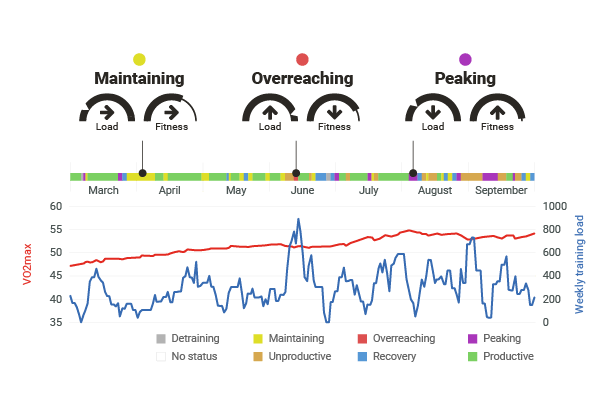
Forerunner and Training Status

I’ve got to like this dashboardesque feature the more I glance at it. It combines the insights of Training Load and VO2max to reveal the relationship between your activities and your personal fitness level. The feedback it offers gives you the ability to evaluate the effectiveness of your programs and routines, understand where you are in a training cycle, and learn how your body responds.
If you are following a proper training plan geared towards a specific race then Training Status may be a good check of how well the plan is working for you.
If ‘Peaking’ unexpectedly appears, get down to your local parkrun promptly and run really fast 😉
- Firstbeat Factette: The first Garmin devices with Training Status were the Fenix 5 & Forerunner 935 (2017)
Usefulness?: 7/10. It’s kinda interesting to see what Firstbeat think. But, to me, the usefulness of this stat comes in more as an alerting mechanism eg if my fitness or load were falling when my plan says they should not be. That rarely happens but when it does it is important to promptly address. Perhaps if you were ‘randomly training’ and not following a plan then this might be a much more useful feature.
Forerunner and Recovery Time Advisor
Another EPOC-based metric, Recovery Time looks at the degree of homeostasis disturbance resulting from your most recent effort combined with the amount of time remaining on your recovery clock to predict when your body will have completed the work or restoration and adaptation. One popular misconception regarding Recovery Time feedback is that it should hit zero before your next session. What it’s really telling you is how long it will be before your body is ready to benefit from a tougher, fitness improving, workout. What’s a fitness improving workout? Essentially we’re talking about sessions with an Aerobic Training Effect of 2.5 and above. Lighter efforts are a good way to promote recovery, as long as you don’t over do it.

.
This will usually pop up at the end of your run. It will NOT be stored in your workout history as, for example, one hour later your recovery time will have changed.
- Firstbeat Factette: The first Garmin device with Recovery Time was the Forerunner 620 (2014)
Usefulness? 9/10 I don’t treat this measure as the ‘truth’ but I certainly take it into account when training frequently. For example, if I do an evening workout and I get a recovery time of 21 hours then I may delay any workout scheduled for the following morning. For the sake of a 5-second glance at the end of your workout, this is 5 seconds well-spent. You can always ignore what it says
VO2max In the Garmin Forerunner
A higher VO2max makes sport AND THE PHYSICAL RIGOURS OF LIFE easier. Sometimes us sporty people forget that.

VO2max is a relatively definitive metric of fitness. Improving it should indicate you are potentially faster but, critically, it does not take into account the economy of your technique. So we could both have a RUNNING VO2max of 60 but if your running gait is more efficient than mine then it’s very likely you’ll beat me in a 5k.
Maintaining your VO2max can also reduce the physiological impact of stress, makes it easier to recover, and can help stave off the effects of ageing.
I am somewhat intrigued why Garmin/Fristbeat display daily trends of VO2max. For me, these values can vary quite a bit…say by 5 percentage points. This clearly DOES NOT reflect the reality of what my VO2max actually is, as VO2max is a relatively slowly changing state. So, perhaps, what Fristbeat/Garmin are showing is my effective performance stated in VO2max equivalence terms??? IDK.
You can’t generally do anything with VO2max. It’s a marker of your progression or badge of honour, depending on how you want to see it. Whilst Garmin says the high 50s are ‘superior’, really I would say elite athletes will have values in the high 60s – or higher.
- Firstbeat Factette: The first Garmin Device with VO2max detection was the Forerunner 620 (2013)
Usefulness? 5/10. In itself, I would take this measure with a pinch of salt until it stabilises after a few weeks. Even then it’s pointless to regularly look at BUT perhaps helpful to know when a specific workout indicates you are performing at a higher/PB VO2max level. The REAL usefulness of these measures is that a lot of the other Firstbeat stuff is derived from it.
Heat & Altitude Acclimatization – VO2max & TRAINING STATUS adjustments
You will not normally see temperature acclimation or altitude acclimatisation unless you stray above 22ºC (72ºF) or an altitude of 800 m (2625 ft.) – 4000m. The altitude readings are triggered by your Garmin but the temperatures are triggered from weather services via your Connect app.
In these conditions, your VO2max and TRAINING STATUS screen, below, are slightly modified. You can see the SUN icon indicating that temperature acclimation is active. Full adaptation to these conditions will take you at least 4 days.


Usefulness? 6/10: I can see how this feature might be useful to a select number of athletes who specifically use altitude training. Perhaps more useful to mere mortals will be heat acclimation for hot summer races??
Forerunner and Training Effect
The two Training Effect metrics are important and, in my experience, they seem to reflect well the session I’ve just completed.
 Aerobic training Effect
The further away from race day you are and the longer your race is to be then the more important achieving a high AEROBIC training effect is. Typically you will see the effect from the whole workout at the end of the workout and the screens are shown below will also be stored in your workout history on the watch.
To progress and improve, you need to challenge yourself in the right way and at the right level. Aerobic Training Effect analyzes your performance to reveal the impact of your activity on the development of your cardio-respiratory system. The fitter and more active you are, the harder you need to work to improve. Behind the scenes, your watch takes this information into account to ensure that the Aerobic Training Effect feedback you get always reflects your own personal situation. Note: prior to the introduction of Anaerobic Training effect in 2017, Aerobic Training Effect was simply called Training Effect.
- Firstbeat Factette: The first Garmin device with (Aerobic) Training Effect was the Forerunner 610 (2011, TE)
- TE can also be shown as an accumulating metric throughout your workout. Other vendors (eg Suunto) have introduced adaptive workouts that target TE goals and curtail the workout once you have achieved the goal.
Images below
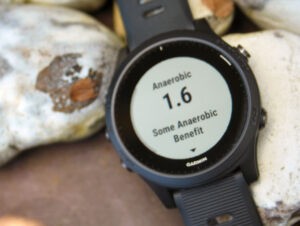
Anaerobic Training Effect
A powerful metric, this analysis reveals the impact of your activity on the development of anaerobic performance capacity. A lot of the confusion surrounding Anaerobic Training Effect comes from the fact that it doesn’t necessarily have much to do with how much time you spend in what some people refer to as the anaerobic heart rate zone (>LTHR/AnT/LT2/Z4). Instead, Anaerobic Training Effect is designed to accumulate when you challenge yourself with sustained bursts of intense effort interspersed with lower intensity efforts that give your body a chance to recover. HIIT sessions are a great way to register a higher Anaerobic Training Effect score, especially when the intervals performed focus on efforts in excess of your VO2max.
- Firstbeat Factette: The first Garmin device with Anaerobic Training Effect was the Fenix 5 (2017)
Images below
Training Effect & Workout Labels
The two Training Effect measures are combined on one summary screen to which is added the WORKOUT LABEL (shown below as BASE in the image below, in blue). And then there are further screens (not shown) where a little more commentary is added about each training effect.
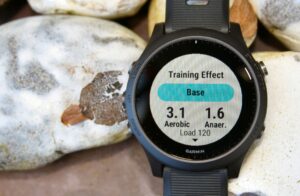

Usefulness? 9/10: I really like these screens and the data they give. The three metrics AnTE, AeTE and Workout labels give me a NICE summary of my workout. Sure it usually coincides with how I feel and what I know I have planned to do but sometimes it’s just nice to have someone else agree with you 😉 If anything the workout feedback tells me that the session should feel easier than what it did…aka I’m not trying hard enough sometimes.
Forerunner and Training Load

If you trained with me then, for sure, I would be looking at your Training Load (TL). It’s important.
Whilst TL is still more complex than the limited view presented by the Firstbeat metric, this is still a great place to start to understand more about the effect of your training.
Long runs, tempo runs, intervals, cycling, going to the gym? Mix things up, it doesn’t matter. Firstbeat’s Training Load reveals the combined physiological impact of all your activities in the past 7 days. As you can see from the image, it looks like the LOAD is also split each day and colour coded according to the training zone (sort of) – see next section!
What are the numbers? Your Training Load is ‘simply’ the sum of the EPOC values of your activities. EPOC is used to describe homeostasis disturbance and when placed into the context of your fitness level (VO2max) and activity history also provides the basis for your Training Effect. In the world of elite sport, sports scientists are increasingly turning to this type of training load data to help athletes reduce injuries through smart application of load over time.
- Firstbeat Factette: Training load for cycling requires a power meter.
- Firstbeat Factette: The first Garmin devices with Training Load were the Fenix 5 & Forerunner 935 (2017)
Usefulness?: 7/10. Training Load is super-important to me. Maybe I’m biased or blinkered in that respect. It seems to me that the Training Load info given here is a bit lacking on insight and actionability. Give me more (please)
Training Load FOCUS aka Training load Balance

 This looks at how you have invested your time across the training ‘zones’ (Anaerobic, high aerobic, low aerobic) AND it puts a little oval to show you the goldilocks zone – the OPTIMAL area.
Again, this is a backwards-looking measure which is nice enough. But I would like to see more actionability to answer the ‘So What’ question. How should my load be split over the coming few days? A recommendation just for tomorrow would be great although it is nice that the Forerunner gives you a textual ‘steer’ on what to do next (see image)
Usefulness? 7/10. Both useful and, yet, could be more precise & useful looking forwards
Forerunner and Lactate Threshold
This is the only training metric onboard the Garmin Forerunner 945 (review) that absolutely requires that you have your watch paired with a chest-belt. This feature uses Heart Rate Variability (HRV) data captured across a range of intensities to identify your lactate threshold. Your lactate threshold responds to training, meaning you can improve it by challenging yourself in the right way. Once your device has detected your lactate threshold, you have a chance to use this information to personalize your heart rate zones based to match your personal situation.
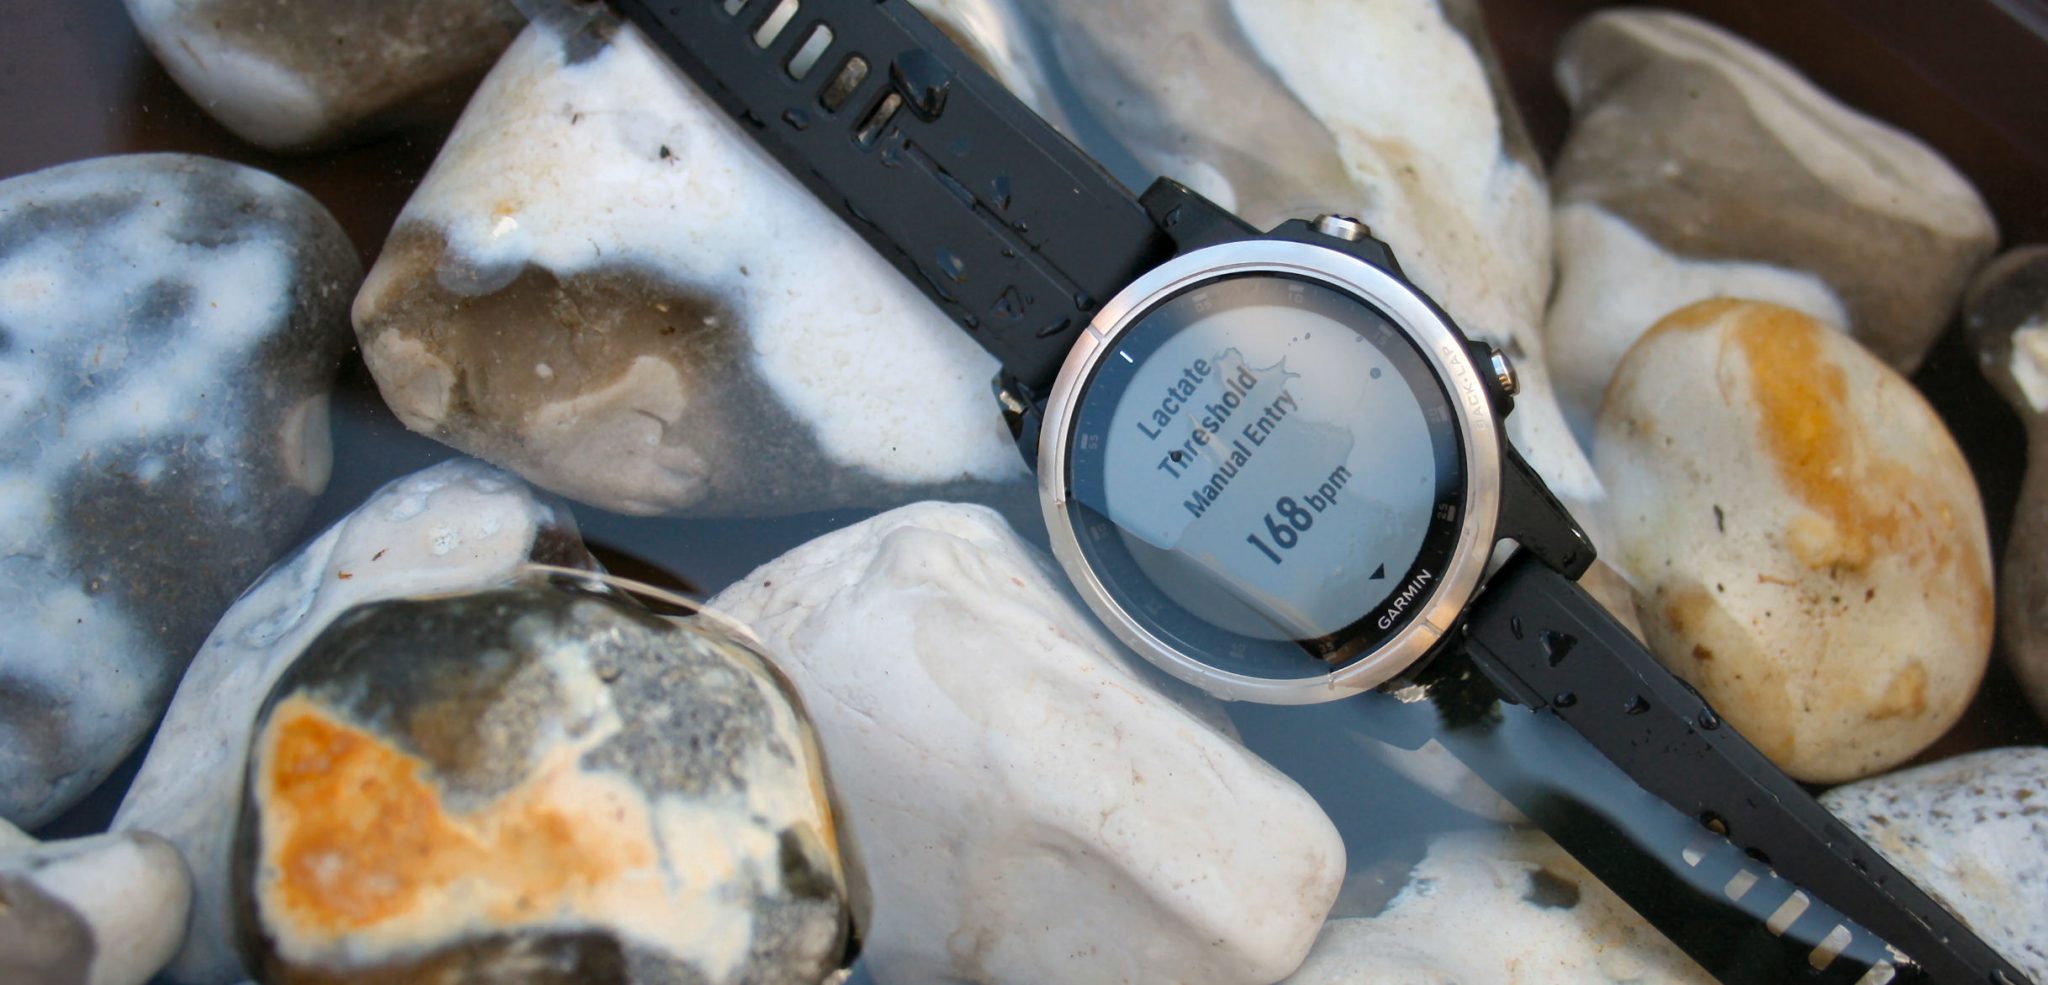
You will get a Lactate Threshold heart rate AND and Lactate Threshold pace. If you are not so fit then you might be able to maintain this for about 40 minutes but the fitter you get the longer you can maintain it for ie WELL over an hour. For me, it’s not quite my half marathon pace, if I only run-trained I reckon it would be my HM pace. Personally, I think the LTHR may be slightly over-estimated by a few BPMs based on lab tests.
Don’t forget that your HR zones may well be best-determined by basing them on LTHR rather than HRmax.
- Firstbeat Factette: The first Garmin device with Lactate Threshold was the Forerunner 735xt (2016)
Usefulness? 9/10. I’m a little concerned about the accuracy (looked at over the last 2 years on many devices!!). Wannabe athletes REALLY need to look at and understand AeT and AnT/LTHR. It’s fundamental for how you can perform.
Garmin Forerunner and FTP
Cyclists all know that FTP is pretty useless.
Haha. Just kidding. A whole sub-industry has been built up around FTP. I use power and FTP a LOT but don’t be taken in by the glitzy catch-all it seems to be. Read around to understand it, then Google XERT.
Your Functional Threshold Power (FTP) for cycling represents the highest, constant level of power that you can produce whilst not accumulating lactic acid. It’s probably NOT 60 minutes for most of us…probably less. Maybe higher for those who are well-trained. Regardless of that, we tend to say it’s your “60-minute critical power aka CP60” and we derive power zones and other training insights from that. You can estimate your FTP in a shortened test or measure it in a lab test. Firstbeat derives estimates of FTP from your routine efforts, which is potentially less hard on your body than some of the FTP testing protocols that exist.
Usefulness? 9/10. Yes, FTP and power are super-useful. Yes, it’s great that FTP can be estimated by Firstbeat from sub-maximal efforts.
Forerunner Race Time Predictor
There are various race predictors online which can extrapolate your performance at one distance to another. Just because you got a 5k PB with lots of anaerobic training does NOT mean that you will be able to anywhere near achieve a race predictor’s time for a marathon. This screen on the latest Forerunners is unchanged in appearance compared to several models ago from several years ago. However, my understanding is that Garmin has moved from their own calculations behind the scenes to use those from Firstbeat, like this…
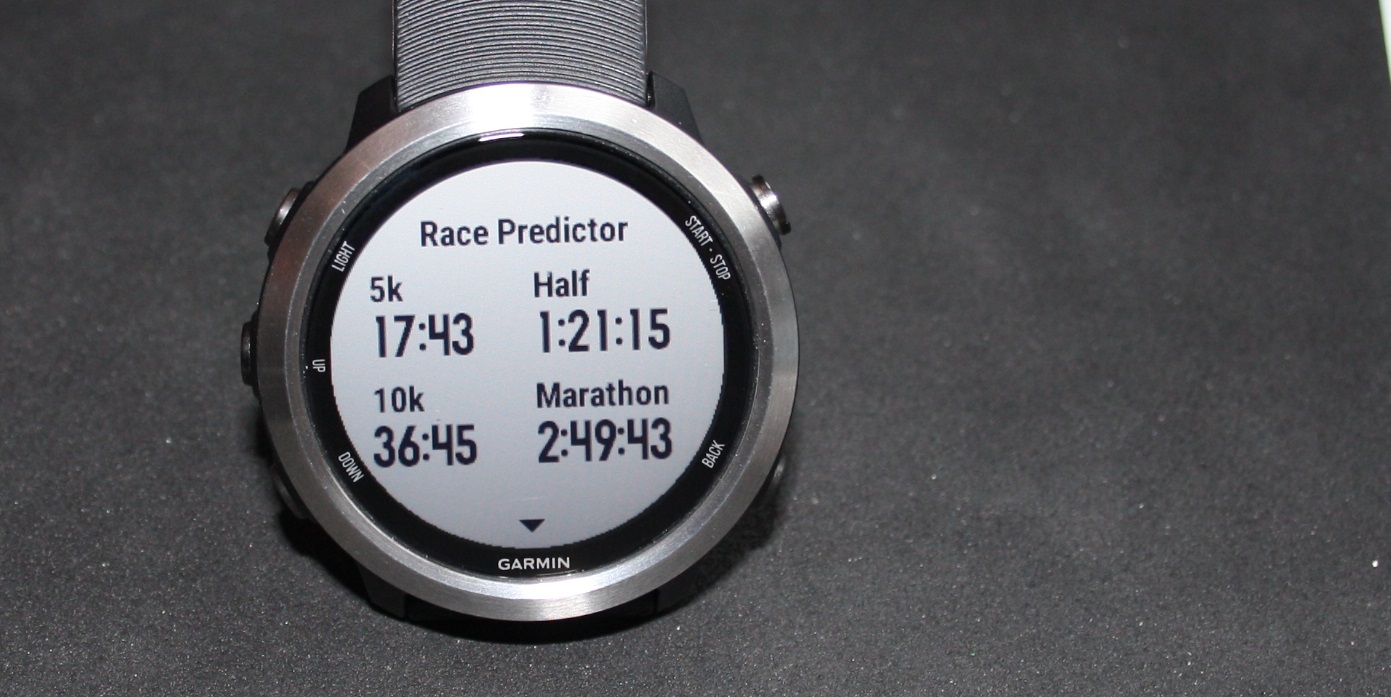
Usefulness? 7/10. You can probably extrapolate your 5k time to your 10k time and vice-versa. For other comparisons, this is more of a guide to what your physiology could achieve with the correct stimuli for the distance.
Garmin Forerunner & Calories Burned
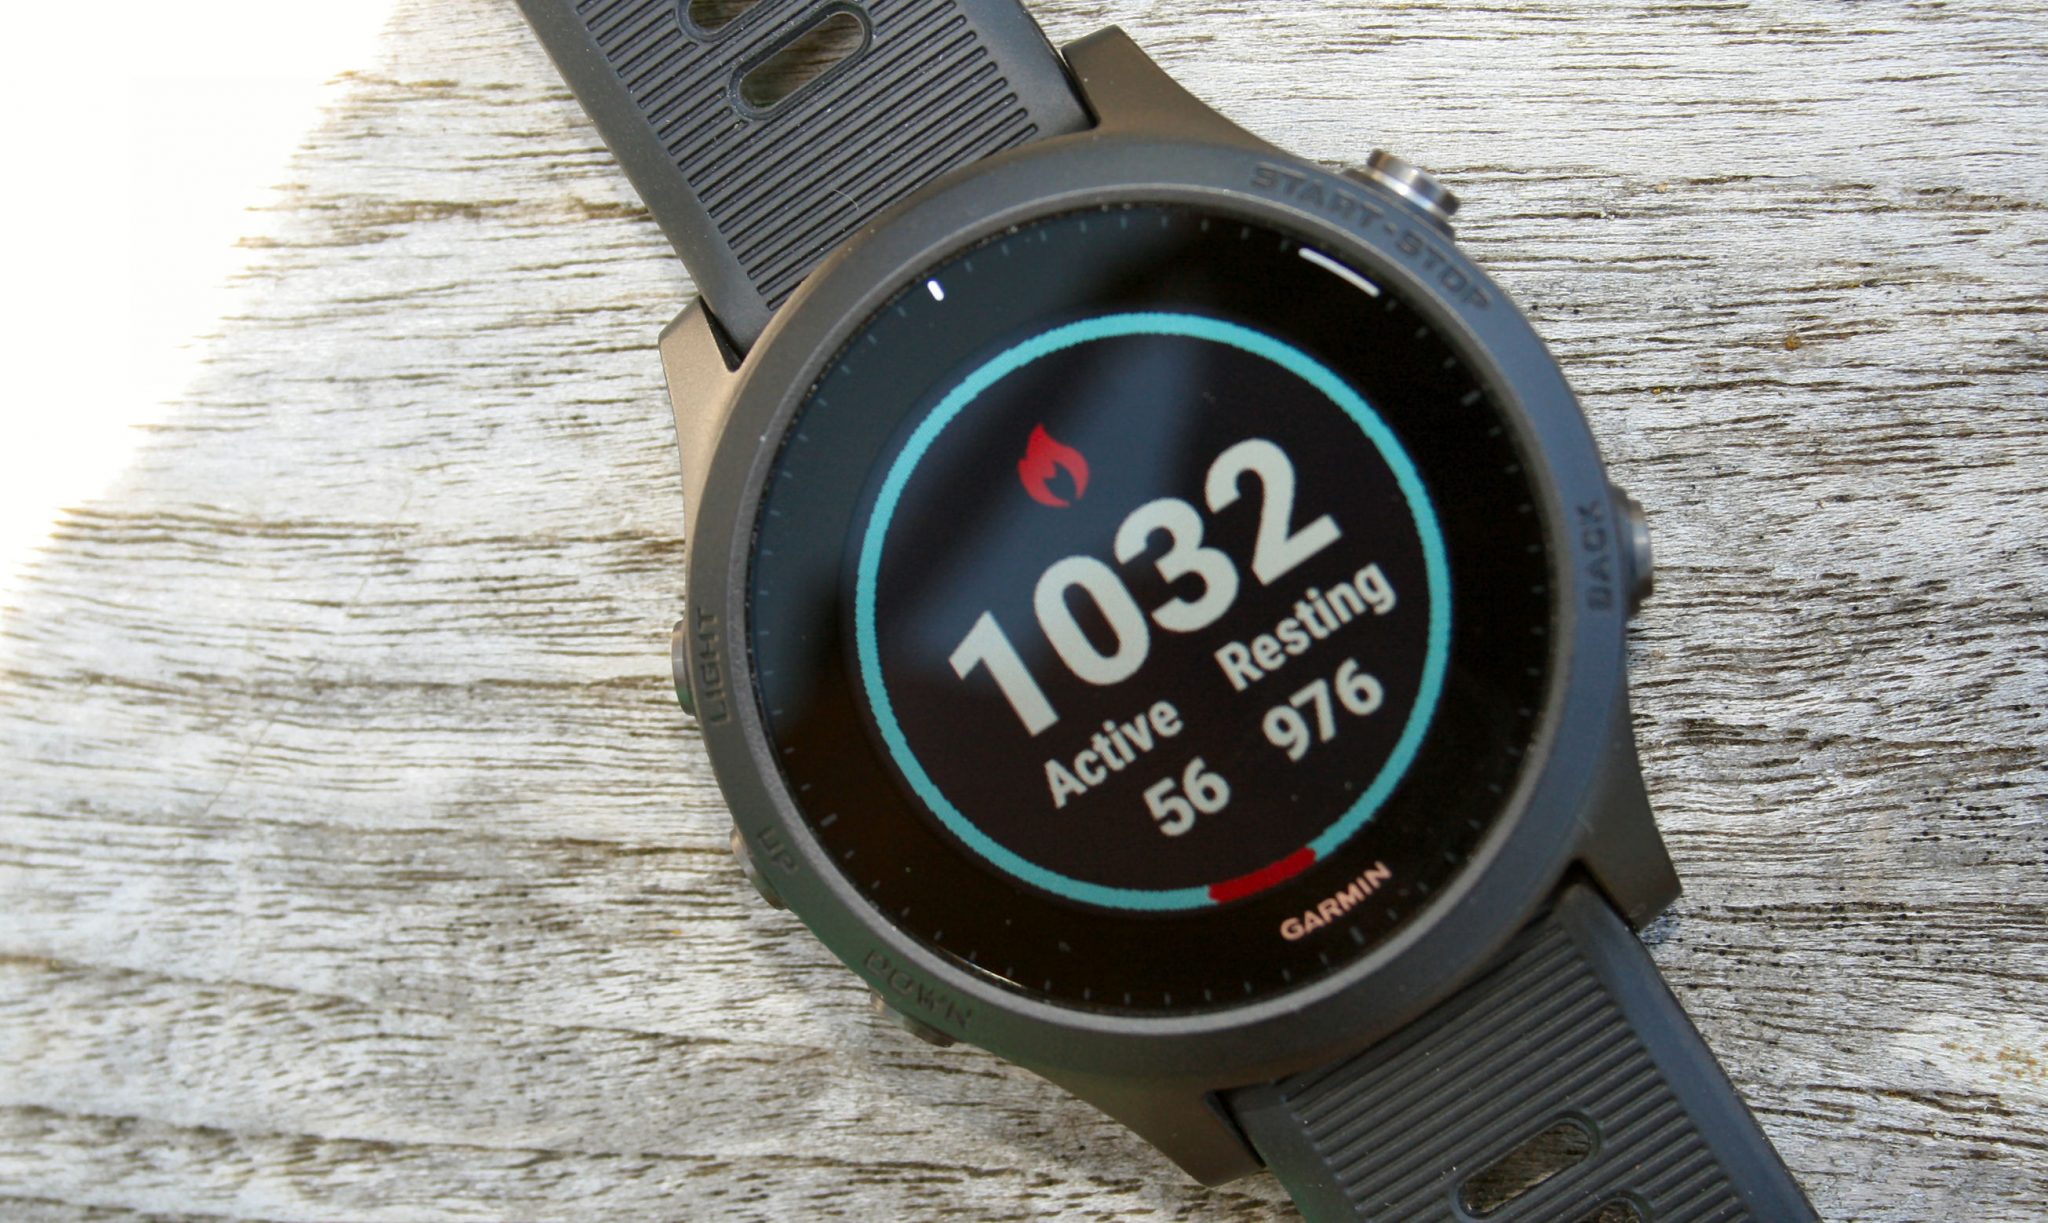
Hey. You know what calories are.
Usefulness? 5/10. I mean calories in-out are obviously important but…you’re a triathlete worried about training too much rather than eating too much, right?
Garmin Forerunner & Respiration Rates
I’ve always wanted this metric and knew it was possible YEARS ago from HRV-derived data. Now that I have it, I’m not quite sure what to do with it.

In some sports lab tests, Ventilatory Threshold (VT) is marked. Maybe there is a use there?
Usefulness? 5/10. I mean, breathing is obviously important but….do I target a higher breathing rate or monitor it over time?
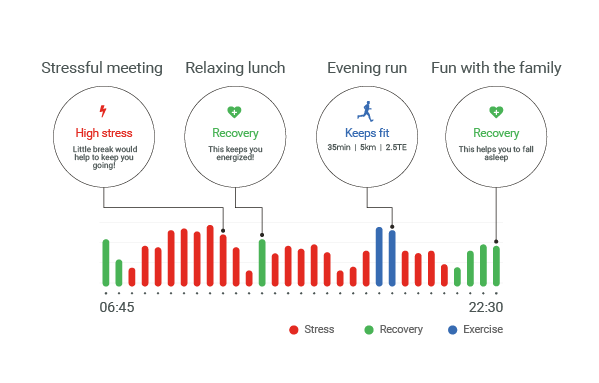
Garmin forerunner and All-day Stress and Recovery
Stress can be something of a mystery, but it doesn’t have to be. The Forerunner features a special heart rate variability-based analysis capable of revealing the presence and intensity of the stress you experience. Checking in with this feedback will allow you to pinpoint activities, interactions, and events that produce stress in your life.
You can also see when your body is in a state of rest and recovery. This can be particularly important when looking at your overnight stress data, which will shed some light into the restorative quality of your sleep. When examining this feedback, it’s essential to understand that stress isn’t necessarily a bad thing, and experiencing stress is an important part of life. The key is to ensure that stress is offset with adequate recovery, and maintaining this balance between stress and recovery is vital to being able to benefit from the challenges you experience in life and through your activities.
- Firstbeat Factette: The first Garmin device with All-day Stress & Recovery was the Vivosmart 3 (2016)
Usefulness? 3/10 – I guess it’s nice to know.
Garmin Forerunner and Quick Stress Level Test
On a scale of 0-100, how stressed are you right now? high=stressed.

There’s also a related link on the watch to a quick meditation period.
Usefulness? 3/10. Unless you are a stressed-out person.
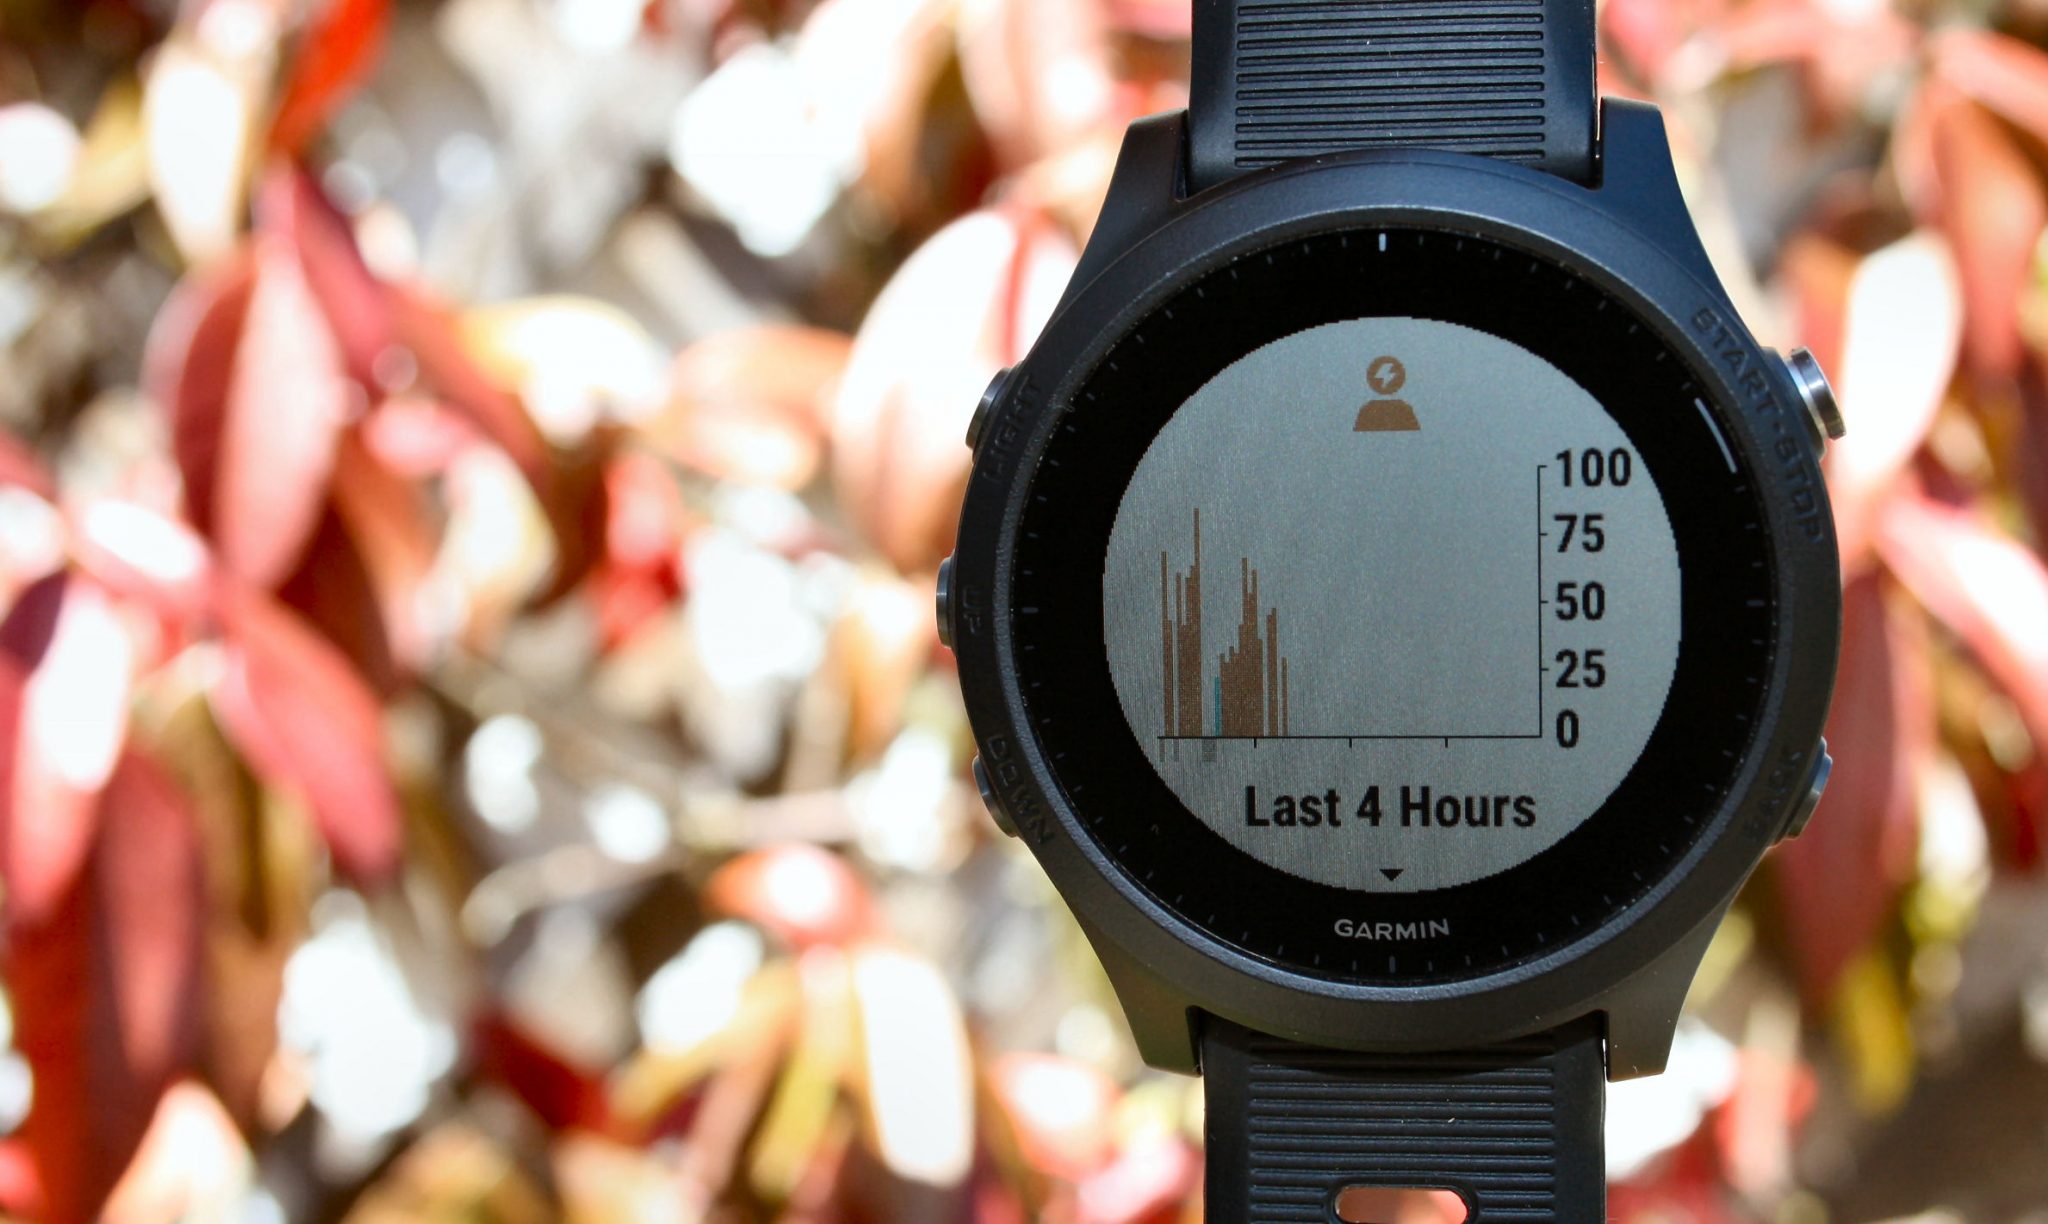
Forerunner & Body Resources
 I’m not quite sure how accurate this is as I spend much of my life sitting down and then periodically getting up and doing something crazy for a few hours. So I’m a little concerned that this shows me as stressed as soon as I get out of bed. I think I’m a fairly chilled-out person.
The blue line in the chart represents your body battery or body resources. The higher it is the better prepared you are for mental and physical challenges. Overlay that with ‘stress’ and your activities then it’s certainly an interesting chart to see the interplay of these factor throughout the day
Usefulness? 4/10


Reader-Powered Content
 This content is not sponsored. It’s mostly me behind the labour of love which is this site and I appreciate everyone who follows, subscribes or Buys Me A Coffee ❤️ Alternatively please buy the reviewed product from my partners. Thank you! FTC: Affiliate Disclosure: Links pay commission. As an Amazon Associate, I earn from qualifying purchases.
![]()
https://i.redd.it/meifld2el5y21.png
I found Performance Condition very useful for cycling (indoor but also outdoor) as it compares Power and HR. Running PC is sort of meh. I mean it would be superb if it compares running power and HR or if at least a gradient is considered for pace to HR calculation. (or maybe Firstbeat algorithm should not calculate PC if it sees lumpy terrain from altimeter) So OK if one is running on flat terrain but if its hilly terrain then PC doesn’t reflect reality.
VO2 estimation never scored me anywhere near my lab results. Garmin always overestimates VO2 on my watches for both running (over 6 pts compared to lab test) and 15 pts in cycling. 🙂 Nevertheless the changes in Garmin’s overestimated VO2 should still reflect changes in performance and fitness, I guess … and hope.
FTPa and LTHR for running were pretty spot on, same for cycling FTP derived from HRV Firstbeat estimation.
Thanks for this post and very good summary of Firstbeat stuff on Garmin watches, good reading as always. I would personally score those metrics pretty much the same except PC, VO2 for reasons above.
I’m curious about how those readings of the watch would compare to Firstbeat’s own products (Bodyguard and the Sports Cloud app). If the metrics and results align or if there is an additional “Garminification” of the data.
i doubt there is garminification
Thank you for the write-up!This is really useful.
Just to give you a confirmation regarding the race-predictor: I use a 945 and a F5+ (with data-sync).
The 945 gives me completely different (slower) and very meaningful race-predictions. While the F5+ is doing what every Garmin was doing (and sooo many people complained about): giving unrealistic values. I run (and raced) since 20years now, the 945 value are within the range of the times that I’d expect if I’d start at such a race. The F5+ values are just, well nice to look at 🙂
Good to hear ! Can you give us an example of the different 5k/10k/HM/M predictions based on a given VO2Max ? Having said that maybe the new predictions also factor in the 4 week training load.
The reason for this is that Firstbeat uses the VO2Max they came up with and look up the respective times using the VDot look up table. VDot and VO2Max are not the same though, for any given VO2Max, the corresponding VDot is quite a bit lower, resulting in too optimistic equivalent times (how JD calls them).
Apparently the new metrics used in the 945 (and Marque?) changed that, that’s why you see more realistic times.
Also, for Marathon predictions they stopped using the equivalent times (highly unrealistic if you lack the miles), but now take your long runs into account to see if you’re in “Marathonshape” (something runalyze has been doing for quite some time now), and adjust your time accordingly.
Good idea to bring up Runalyze as it does provide a great set of metrics for free, one of the reasons I am not upgrading my 935 to the 945 😉 VO2max is generally very close between the 935 and Runalyze but the 935 does indeed use the “wrong” lookup tables ! As for “marathon shape” it works pretty well in Runalyze although I find it a bit pessimistic. There are ways (reduce distance that triggers its increase) to fine-tune it though.
This. I don’t like GC at all, and quite frankly find lots of their graphs to be highly unreadable because of unfortunate scaling on the y-axis, not to mention the lack of actionable information within GC.
That said, I use Runalyze, and have a premium TP account, both of which take care of my physiological metrics, and provide actionable data.
I do think, however, that Firstbeat Pro offers a much better service than the indeed “garmified” watered down solutions you buy into with a Garmin watch. Which makes sense at €299/year vs a one-time payment to Garmin.
Thanks for the write-up as Garmin remains rather mysterious about all these metrics. Good job on calling out the REQUIREMENT to use a chest strap to get any meaningful data, you definitely cannot rely on a wrist oHR for that and I think too few people realize that.
A few questions, since you have someone from FB “on the line” :
– Does PC use HRV? I’m thinking it does because I track HRV separately (with HRV4Training) and sometimes it seems that PC is not only Pace/HR derived
– Lactate Threshold has been messed up on my FR935 for 1+ year as far as pace goes, it’s ok for HR though. It worked well enough (both auto-detection and the test) for a few months, maybe from May to October 2017 but it’s been broken ever since. It consistently gives me Pace values slower than my HM pace when it should be around 15k pace.
– There doesn’t seem to be any way to link the values in Training Load and Training Focus ?
– I’m surprised that you get big swings in VO2Max, I find it very consistent and if anything it seems it’s smoothed over several sessions. Unlike the “instant” values you get from Runalyze for instance.
I brought this question some time last year to Firstbeat and got this from support.
I’d simply “thumbed up” your reply last month but after some more runs I’m still under the impression that it’s more than just pace/HR that’s being looked at by PC. I’ve had situations where that data is really close and expect to get a 0 or +1 but for some reason there’s a -3 and that seems to be linked to the lack of sleep the previous night, something that has an impact on HRV (as can be seen with HRV4Training for instance).
Just a guess but I wonder if they didn’t interpret your question as “is anything else than Pace/HR needed to calculate FB features” ? Clearly only LT and FTP have that requirement.
I regularly do multiple, consecutive sessions. eg a warmup run and a warmup bike followed by a further run. in that scenario you would have thought PC would be the same for all 3. but it rarely is. Should a warmup affect PC? I guess you could argue either way.
Firstbeat… good keyword. Here a very excellent piece of work.
ty
long but good
THanks for the write up. From my experience the FirstBeat metrics are cool and geeky to look at and think about, but I struggle to put them into real use. For instance, if recovery advisor says I still have 2 hours to recover from a run I did last night, but I have a ride planned in the morning, I always just ignore it. Maybe with the advent of adaptive training plans this will all work in the future. For now, I don’t find much value in it. I have often thought the same about sleep tracking. Neat to look at, but if I am binge-watching the latest hit show, I don’t often think about my hours of REM sleep, and how I need more hours of sleep… In other words, I already intuitively know I need more sleep and should go to bed earlier, but tracking my sleep doesn’t actually lead to me taking any action to get more sleep. Work, family, life always get in the way, and I workout how I can, when I can. Seeing that my body battery is peatering out doesn’t influence my choice to have a swim.
I would love to see a write up about each of these metrics and (not how someone CAN use them, but) how someone IS using them in the real world to improve their fitness.How can we make these metrics actionable?
Do you think the Race Predictor differs from that in 935?
Yes
the 935 had Garmin’s Race Predictor
The 945 has Firstbeat’s
For me the most useful features are:
– Training load 10/10 (am I pushing hard enough)
– Quick stress test 9/10 (a light variant of Polar’s Recovery Pro)
– Lactate threshold 8/10 (for training intensity)
– Training effect 7/10 (did I do the training I planned)
– VO2Max 7/10 (tracking of longterm progress)
Body battery, stress and sleep tracking and all the rest are just nice to know.
” – Lactate threshold 8/10 (for training intensity)”
Are you getting meaningful pace data with the LTHR auto-detection or test ? Mine has been way undervalued since the end of 2017 (worked ok before that). It gives me a pace slower than HM pace which is obviously incorrect. HR is ok though.
do you look at TE on external software? … it can give more insights than fro Garmin. super useful IMHO
Good overview with one exception:
The way I interpret the recovery advisor, and really it doesn’t make sense otherwise, is that it shows the hours until your are completely rested, not until your next workout. Now, no training plan will allow you to relax completely (except maybe for/after an A-race effort), since that is detrimental to building fitness, it’s the exact opposite of how exercise physiology works.
When your Garmin shows say 32 hours, it doesn’t mean you have to wait 32 hours until your next (hard) workout. It just means that as long as the recovery advisor is in the orange you should train easily. As soon as it’s green you’re good to go hard again. If you were say just slightly into green the added recovery after that hard workout will be well above 32hrs from before (maybe even in the red), resulting in more time before you’re back into green, creating the needed effect of resting/recovery. Same with being in the red (usually after HM effort or higher). Wait until it’s orange for an easy workout, or green for a hard one. The guidance is actually in the text, rather than the number of hours.
Great summary! Very helpful – 945 on order. One question, how does the training load and training focus cope with multi sports (swim, bike and run)…
– where training focus may be different per sport
– when bike is recorded on an older Garmin 520
– when other sources are recorded in Garmin Connect e.g. from TrainerRoad or Zwift
Thx!
blimey, that’s a hard one
load will come from HR and sometimes maybe power. with different zones per sport then TL can account for that.
I’m not convinced that multisport laod is correctly accounted for (whatever the official explanation I could provide a counter argument). However swim load will be trivial for most people who do 2-3 hours of swimming a week. it’s usually the bike and run that are the big hit.
i think the data for your cycling must come from a physio True-Up compatible device IIRC the 520 is not one of those (I could be wrong on that). you are best to use the 945 as a recording device for ALL your endeavours. obviously the 520 is a superior training tool for cycling so use that as well for cycling.
TR/Zwift – I can’t remember if they are included. I would say NOT. again use the 945 to record everything.
whilst the end result may not be perfect it will give you useful GUIDANCE and so is worth doing on the 945. you don’t HAVE to do what the watch says.
Thanks for the reply. Will get the watch then experiment….
Can the 945 be paired with the Polar H10 instead of the Garmin HR-Run to get Lactate Threshold? And can I also get running dynamics data (vertical oscillation, ground contact time) wearing the Polar H10. Thanks for your help in advance.
i think so for the first one (but not sure), i’m going to ask firstbeat for a definitive answer.
you can pair the h1 as ANT+ and that will probably work
for the second, definitely not.
Thank you for your response. And I appreciate you reaching out to Firstbeat to confirm if a Polar H10 can be used to get Lactate Threshold on the 945. Please let me know what they say.
“there shouldn’t be any differences between belts when it comes to our analytics engine. Obviously, though, if the belt is transmitting just an HR instead of the beat-to-beat intervals, then you won’t get some information like Respiration Rate during exercise and the Lactate Threshold detection”
“pairing via ANT vs Bluetooth shouldn’t necessarily cause any variation. “