EMFIT QS is an under-mattress monitor of recovery and sleep quality. It certainly appears accurate to HRV level and I reviewed it <here> in March 2016.
Having continuously used it since then my view is largely unchanged. It’s the best product I’ve seen in its category. The downside is that it is too good at taking the readings and producing the stats. Too good in the sense that it does NOT require a manual HR reading each day, that means that you (I) forget to look at your recovery and readiness to train ie you forget to use the data and analysis as there is zero manual intervention!
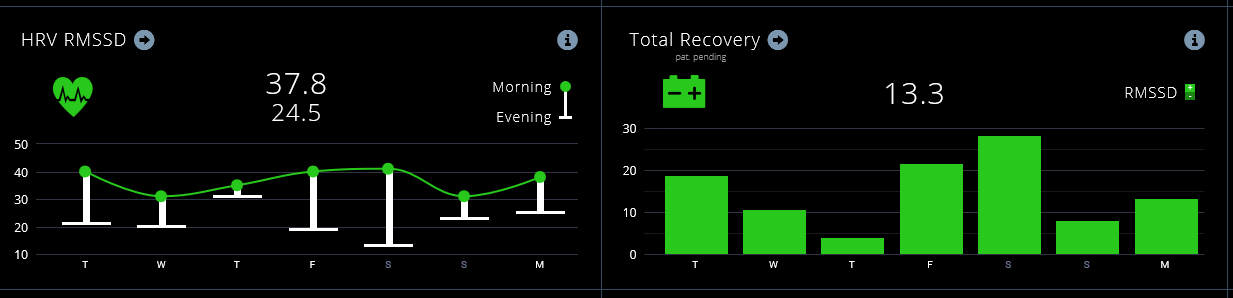
But there is some good data. Look at the chart above. You get a whole night’s worth of RMSSD readings – with that data you can take a view on your recovery/adaptation through the night which strikes me as being WAY more likely to be accurate than looking at your sleep patterns (REM sleep and that stuff). Although it does that as well 😉 So the chart shows hardly any recovery on Thursday night but lots on Saturday.
IMO they clearly have to work on automating alerting and/or integrating with other data platforms that athletes might use more often. Personally, I’d be happy with a daily email alert if anything unusual happened.
For example, we’ve seen ithlete recently linking in with your Garmin Connect data. That’s a great way to make you want to explore your HRV/RR data a little more, making it become part of your post-workout routine.
Anyway, EMFIT has just updated the system including many new data views (see press release, below).
EMFIT REVIEW QS, Gen 2 HRV ? Sleep ? Monitor, Sleep Tracker [2022 version]
———- Press Release / User Update ——————-
We have good news folks! We have released a major update for our web app at qs.emfit.com. Here are the highlights:
Longtime Trends
With 9 different datasets and with most of them having an option between Daily Values and Month & Weekly Averages, there are now total of 17 dataviews available.
You can now view and analyze all of your historic data with our presets (up to the past 360 days), or set your own custom view range without restriction.
Presence Minitrends with Extended and Configurable Timespan
You can adjust the presence dashboard’s minitrends length between 7, 14, 21 and 28 days. This setting is found under the view Settings > Device > Features.
Fullscreen Mode for Bigger Screen
As you may have already noticed, our web app has already been automatically adjusting it’s design based upon your device’s browser/viewport width… We have now extended this to leverage the full screen-estate of your bigger screens! This comes especially handy when you’re viewing the long time trends.
There’s a rectangular button fixed on the bottom right corner, that toggles this mode ON/OFF. We have set it ON as the default. Just toggle it OFF if you prefer to use the width-restricted mode (at maximum 1050px wide).
Data Visualization and Colorscheme Upgrades
We have upgraded ALL of our data visualization charts for better readability.
Colorscheme has been polished. All heart related (including all HRV) metrics are now green. We intentionally use strong tertiary colors on the black background to have the eye discern more effortlessly between all of our many data metrics.
New HRV metric: Integrated Recovery
There’s a new metric called Integrated Recovery that is visible on the presence dashboard’s minitrends. This is the total area of recovery during the whole night.
Reader-Powered Content
 This content is not sponsored. It’s mostly me behind the labour of love which is this site and I appreciate everyone who follows, subscribes or Buys Me A Coffee ❤️ Alternatively please buy the reviewed product from my partners. Thank you! FTC: Affiliate Disclosure: Links pay commission. As an Amazon Associate, I earn from qualifying purchases.
![]()
I’ve been using Emfit QS for the past few weeks myself. Due to having cold virus I couldn’t judge usefulness yet. The readings seem to be quite accurate (you can watch some metrics in real time and I also have Polar H7).
I’ve been searching for some details about interpreting HRV data. In-depth article about using HRV (either with Emfit QS or other devices) in practice would be really helpful.
how deep do you want to get into it? if you look at the hrv product websites they have lots of info on them eg ithlete, bioforce, elite hrv. if you look at kubios that is REALLY technical. there is quite a bit on this site, or try this http://www.marcoaltini.com/blog/heart-rate-variability-logger-app-details. you can look at it in terms of recovery, readiness to train or the true stress of your workout and .or recovery within intervals. things like that.