Wearables for Heart Rate Variability (HRV) Measurement: Analysis of Data Quality and Issues with Data Interpretation
Author: Marco Altini (reproduced in full from here, with permission
More and more wearables have started capturing Heart Rate Variability (HRV) data overnight.
Despite some inconsistencies over the past years, as of the end of 2022, Oura, Whoop, and Garmin all work in a very similar way when it comes to this type of overnight HRV measurement, which motivates this blog and analysis.
Here, I will look at data quality and how well they work with respect to reference electrocardiography (ECG), and also discuss issues related to how the data is interpreted in the respective platforms.
High-quality data is necessary, but not sufficient, to make use of HRV analysis. While the goal of this blog is mainly to assess data quality, I will cover also data analysis and interpretation to provide you with some useful tips and tools that should allow you to make the most of the collected data.
Thank you for reading.
Please feel free to reach me (@altini_marco) on Twitter for any questions or follow-ups on this blog
1. Enter the world of Heart Rate Variability (HRV)
HRV is a term that refers to ways to summarize, as a number, the variability between heartbeats.
Right, but why do we care?
For a simple reason: HRV is the most practical, non-invasive, and cost-effective way we have to assess how we respond to stress.
In particular, stress leads to a physiological response that manifests as a change in autonomic nervous system activity. Typically, when we face stress, sympathetic activity increases, while parasympathetic activity reduces. In turn, parasympathetic activity impacts heart rhythm. For example, a reduction in parasympathetic activity leads to a more constant heart rate, while an increase leads to higher variability between beats.
For more details about this mechanism, check out my guide below.
Resting Heart Rate and Heart Rate Variability (HRV): What’s the Difference? — Part 1
The physiology
Hence, measuring HRV is an effective way to capture how our body is responding to stressors, regardless of the source (training, lifestyle, etc.).
In particular, a reduction in certain HRV parameters (for example rMSSD, the one reported by most wearables out there) typically means that parasympathetic activity is reduced. Therefore, we have not fully recovered or in general, there is more stress on our body and we are unable to quickly jump back to our normal range.
Note that our application of interest here is determining chronic physiological stress level, which derives from combined strong acute stressors (e.g. a hard workout, intercontinental travel) and long-lasting chronic stressors (e.g. work-related worries, etc.).
We care about this type of assessment because it is the most meaningful and actionable. By measuring the impact of these stressors on our resting physiology, we can make adjustments that can lead to better health and performance.
To assess chronic physiological stress levels, we have only two options: measuring first thing in the morning or measuring the whole night. This is when wearables come in, as they offer an alternative to morning measurements. Normally, we are not interested in measuring during the day, as this would simply reflect transitory stressors (light physical activity, digestion, having coffee, talking to a friend, etc.), resulting in noisy, de-contextualized data with dubious interpretation and limited actionability.
For more about the basics of HRV, from theory to measurements and case studies, check out the link below.
The Ultimate Guide to Heart Rate Variability (HRV): Part 1
Measurement setup, best practices, and metrics.
2. Wearables, wearables, wearables
You can measure your HRV with various sensors, either a full ECG, or a more practical device that measures the electrical activity of the heart (a chest strap like the Polar H10 or H9), as well as a small number of devices that use optical technology (plethysmograph, or PPG). Most wearables use PPG, either via green LEDs (light sources you can see at the bottom of your sensor, for example, a Garmin watch or Whoop band), or infrared light (not visible to us, as used by Oura).
A couple of important points here before we even start with the analysis.
PPG vs ECG
The electrical activity of your heart (captured by an ECG), and the change in blood volume at the periphery (e.g. a finger or wrist sensor using PPG), are not the same thing. In fact, in PPG there is useful information that is sometimes not present in ECG (linked to blood pressure, this is related to the waveform not really the beat-to-beat data), and using both can be very insightful for different reasons.
At the same time, it is also true that for certain applications, they can be the exact same. For example, if the goal is to extract the beat-to-beat or peak-to-peak data, and compute heart rate and rMSSD, there can be no difference. Having developed technology for both over the past decade and having compared them thousands of times, I have so much data that it is impossible for me not to accept that PPG can be used as a perfect replacement for HRV analysis at rest, when looking at rMSSD, in healthy individuals (note the keywords there: rest, rMSSD, healthy, etc. — not all analysis can be replaced).
There’s a lot we don’t know about PPG, to the point that even the origin of the PPG signal is debated, is it the change in blood volume? is it red blood cells that change in orientation during the cardiac cycle? etc. — fascinating stuff that I will keep following, especially as more methods are developed to make use of the entire signal as opposed to just the peaks. However, it is important that we are also able to recognize what PPG is already good for, which is HRV analysis in the time domain, at rest. Someone saying the contrary is simply not looking at the data and showing their ignorance and bias on the topic.
You can find some data and resources here, to back up the statements above:
- validation of camera-based HRV analysis in HRV4Training (not even using dedicated sensors, and yet, no difference with ECG): https://www.researchgate.net/publication/315059917_Comparison_of_Heart_Rate_Variability_Recording_With_Smart_Phone_Photoplethysmographic_Polar_H7_Chest_Strap_and_Electrocardiogram_Methods
- an independent validation where comparing ECG to another ECG shows a larger error than comparing it to PPG: https://www.hrv4training.com/blog/independent-validation-of-hrv4training (this simply shows typical differences when it comes to HRV, regardless of the technology used)
- the latest data I got out of an iPhone with our processing: https://www.hrv4training.com/blog/support-for-all-iphone-14-models
I need to stress these aspects because PPG gets a lot of pushback for the wrong reasons. Is PPG very prone to artefacts? yes, you cannot move and acquire reliable data for HRV analysis, in fact, you cannot even sit still and type or contract minimally your muscles, and acquire useful data from a wearable, are wearables ignoring all the hard problems? also yes, like not providing signal quality estimates or ignoring arrhythmias, pretending to be working while they give you an rMSSD of 250 ms. There are plenty of issues with PPG. However, PPG can also be very accurate at the task it has been deployed for when done properly.
Not all night data is equal
Collecting meaningful data is a bit of a new problem, mostly introduced by wearables. Until a few years ago, all we had to do was to show that HRV could be measured accurately, as it was taken for granted that you had to measure it first thing in the morning, in what we call a reproducible context (it simply means that first thing in the morning, you can collect the data under controlled, similar conditions every day, and this is ideal to keep track of changes in physiology, no matter what parameter you are measuring).
Check out the blog below to learn more about the ideal routine for morning measurements
How Should You Measure Your Morning Heart Rate Variability? (HRV)
Guidelines and practical tips
Now that we have wearables measuring automatically, things got messy.
This is very important because a device that is accurate, but measures at the wrong time, will provide you with data that is of no use due to the continuous changes that happen in autonomic activity. Depending on when the data is sampled, it might still capture very large stressors affecting dramatically your physiology (e.g. sickness or excessive alcohol intake), but it will miss more subtle changes, which should be the whole point of using these technologies.
If you use a device where you manually trigger a measurement, like a phone’s camera in HRV4Training or a Bluetooth sensor that is paired with our app, then the problem is easily solved: measure first thing in the morning (more details here). If you use a device that measures automatically during the night, you need to make sure the data is collected during the entire night, and not just for a few minutes.
Here is where the Apple Watch and others fail. For a deep dive into these aspects, check out this blog. Long story short, collecting a few 5 minutes of samples per night, or trying to isolate a single 5 minutes sample in a specific sleep stage, will provide very noisy data, which is of little or no use. There is too much variability across such a long timeframe (many hours), which would lead to dramatically different interpretations depending on when you sample that data (hour of the night, sleep stage, etc.).
Never use just a few minutes of data for night HRV.
Measuring during the night adds some challenges in terms of data accuracy and interpretation, which I discuss in-depth in the blog below.
What you need to know about Heart Rate Variability (HRV) data collected during the night
Sometimes the best answer is also the simplest
I will touch again on morning vs night towards the end of this blog, but for now, what matters is that the night is a useful context in which we can measure resting physiology (heart rate, HRV), assuming we do it right (i.e. using the full night of data).
Many of the wearables available on the market now do indeed use the full night of data. It took many years for some of them to figure this out, but as of the end of 2022, Oura, Whoop, and Garmin all work in a very similar way when it comes to HRV, and therefore it is finally worth it to look at data quality. While there might be others, here I focus only on these three as they are some of the most commonly used.
2. Measurement setup
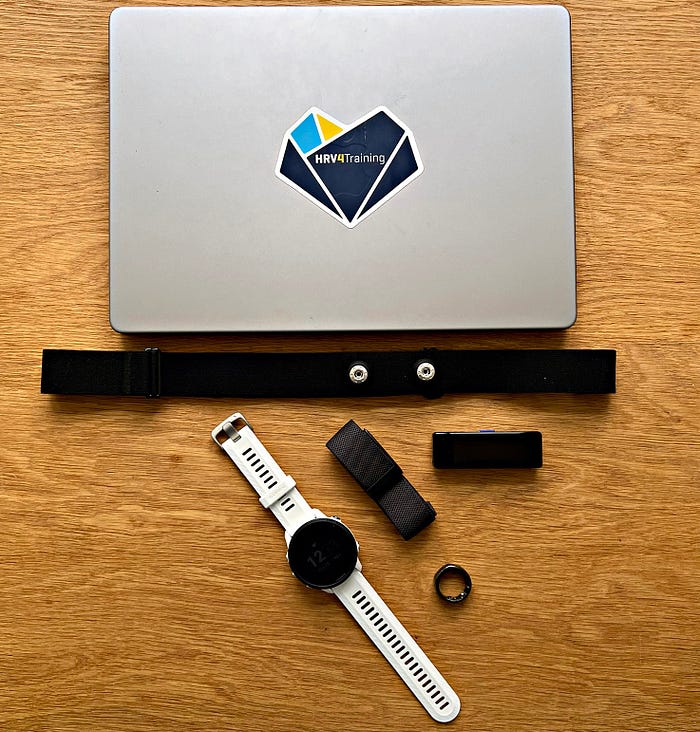
During the past ~three months, I’ve worn the following sensors every night:
- Reference ECG (chest strap). I used the FourthFrontier sensor for this but had to download and re-processed all data as rMSSD is not computed correctly by the device according to my tests.
- Oura ring: worn on the left hand, ring finger.
- Garmin Forerunner 955: worn on the left wrist. I will use this as an example of what Garmin can do, but obviously, it is not possible to test the many devices they have. I’ve worn the watch with a good fit, but not particularly tight (you still need to try to sleep while wearing this stuff).
- Whoop: worn on the left wrist, next to the Garmin watch, but a bit higher up on the arm, which should provide a bit better data quality.
Metrics
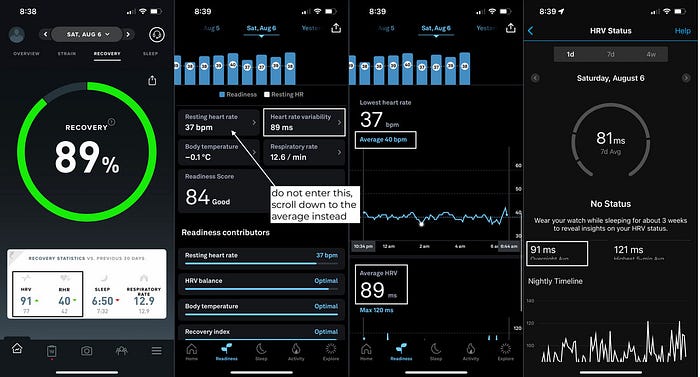
For the wearables, as an HRV metric, I used the rMSSD provided in their apps (for a description of different HRV features, see this). You can find the rMSSD in the Oura ring under Readiness (the average, not the max), in Whoop under Recovery and in Garmin under HRV Status — last night’s average. For heart rate, I used the resting heart rate provided as the average heart rate in Oura (not the minimum, so not what they call resting heart rate in their app), then the heart rate found under Recovery for Whoop and the Resting heart rate provided by Garmin, since they do not provide the average of the night.
2.1 Other sensors
There are other sensors that measure HRV at night and I have excluded them from this analysis for a number of reasons. Most notably, I have excluded the Apple Watch, despite being a sensor that sells a lot, simply because it is not up to the task. The Apple Watch is not only inaccurate when sampling automatically, but it also samples sporadically, making the data of almost no use (and to say the least, extremely noisy).
If you want to learn more about why you should not be using an Apple Watch to track your night HRV, start in this blog, then check also this tweet and linked paper.
Edit: the5krunner: WatchOS 9 now permits full-night HRV recording if the AFIB History feature is enabled.
3. Data quality
We can look at data quality in different ways. I will first look at some methods that are often reported in the scientific literature, mostly to highlight how these methods are not really effective if we think about how the data should be used.
For example, a first check is to look at how close the data measured by wearables is to the ECG data, in absolute terms. However, when it comes to HRV, absolute values are often of very little use, and what matters the most is relative changes over time, both acutely (day to day in response to large stressors) and chronically (over weeks or months in response to lifestyle changes, seasonality or other factors). This is why in my analysis below, I will focus mostly on relative changes with respect to clear stressors so that we can understand what the data is capturing, and how we can use it effectively.
Let’s look at some data.
3.1 absolute values
Below is the distribution of HRV data over ~three months:
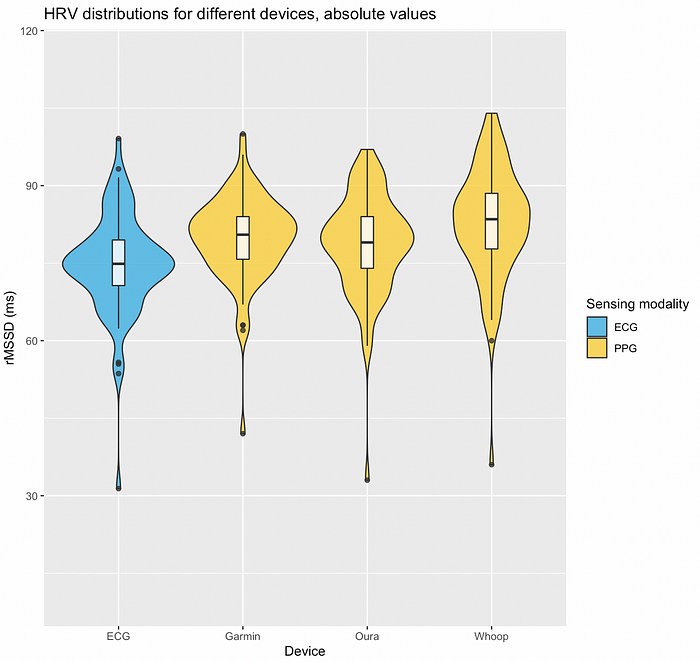
We can see that all wearables overestimated HRV. Oura seems to perform slightly better. Whoop’s HRV seems noisier (larger distribution and higher absolute error). We can also see that all sensors clearly captured one outlier, a particularly low HRV value, which I will discuss more below.
Here is the same data, but shown in a slightly different way: I plotted the difference between the reference ECG and the HRV collected by the different wearables. This way we can better appreciate the differences:
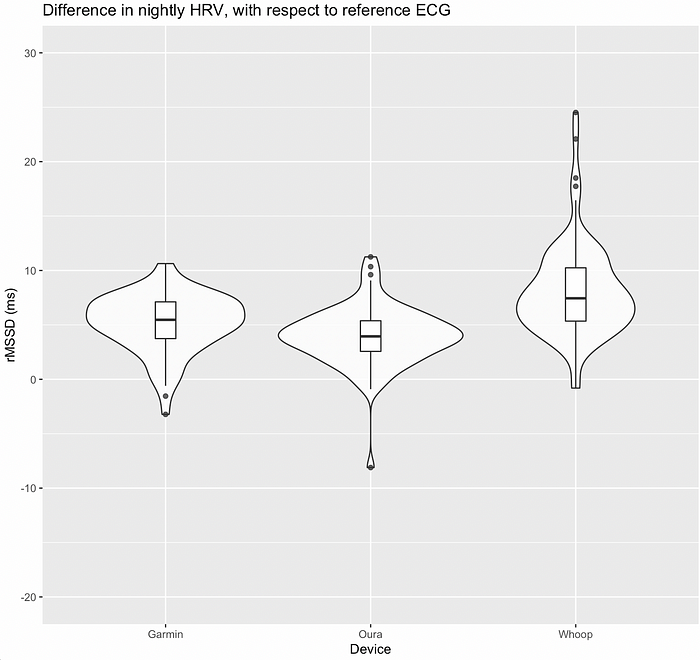
As mentioned earlier, Oura is closer to zero (zero represents no difference with ECG) and has a quite wide distribution, showing that it is more often than not in agreement with ECG. Whoop has a larger error, and is a bit all over the place, with a few outliers (very large differences with respect to the reference, up to 25 ms). Garmin is somewhere in between.
Does this analysis even matter? Well, you do not want to use something that provides an absolute value that is very far from the truth. However, given the limited utility of absolute HRV values, these differences are not a problem in my view, provided that relative changes are a match (more on this later).
Below we can see the heart rate distributions. While this blog is about HRV, I want to highlight how you should never take anything for granted, and how sometimes really odd choices are made, which make easily measurable parameters, such as heart rate, somewhat useless. Below we can see rather similar distributions, as heart rate is really easy to capture with PPG (you just have to count the peaks, the exact timing between them is irrelevant). However, we can also see that Garmin’s data is clearly lower, and misses completely the outlier (a very high heart rate on one day).
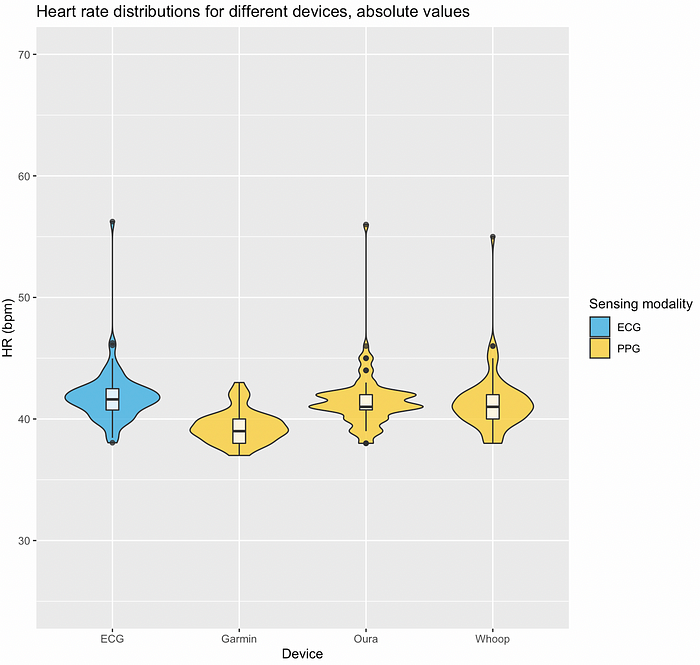
Why is Garmin’s data so different? Their approach here is not to use the average of the night (which they do use for HRV), but to report the 30 minutes in which heart rate is lower, in the previous 24 hours. The biggest mistake here is not really to use 30 minutes instead of the full night, as for heart rate, this would still be a reasonable — even though not optimal — choice. The real issue is using the past 24 hours. Say for example that I get sick in the evening, during sleep my heart rate is quite high, then in the morning I check my resting heart rate in the Garmin watch, and it is still 40 bpm, because it is providing me with my heart rate measured sometime in the afternoon the day before, and before I got sick, but within the past 24 hours. This is exactly what happened here. A weird choice which can lead to big issues, as shown here. This might have to do with the total mess that Garmin is when it comes to software and in particular resting physiology, with many features aiming at doing the same thing, but in slightly different ways (resting HR, Stress, Body Battery, HRV status, Health snapshot, etc. — all things you can happily ignore once you get at the end of this blog and understand how to use the data they provide more effectively).
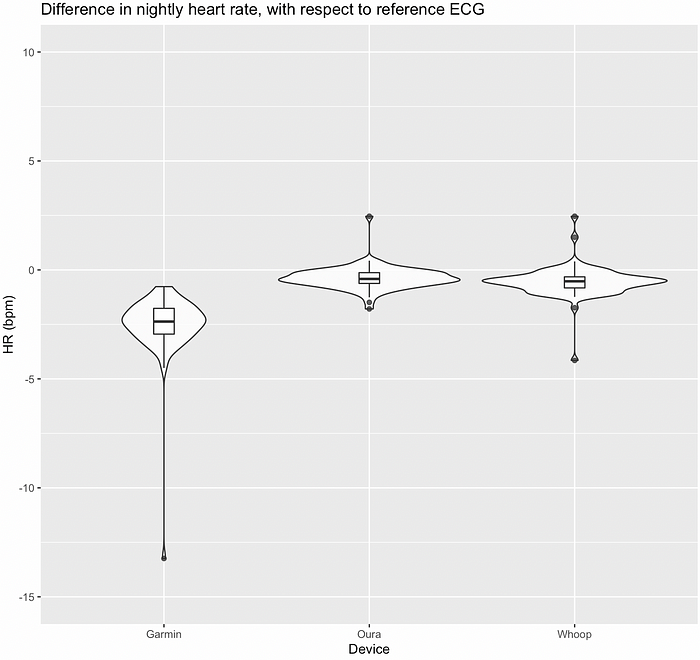
Looking at the same data but in terms of the difference with respect to ECG, we can see very well how Garmin has missed the mark on a sick day, reporting a heart rate of about 13 bpm lower than the reference ECG.
To conclude, these are the average absolute values reported over the ~3 months of measurements:
- ECG, rMSSD: 75, heart rate: 42
- Garmin, rMSSD: 80, heart rate: 39
- Oura, rMSSD: 79, heart rate: 42
- Whoop, rMSSD: 83, heart rate: 41
3.2 correlations
Another way to look at the data is to look at correlations. This is somewhat better than just looking at absolute values, as we can better appreciate the relationship between values captured by different devices.
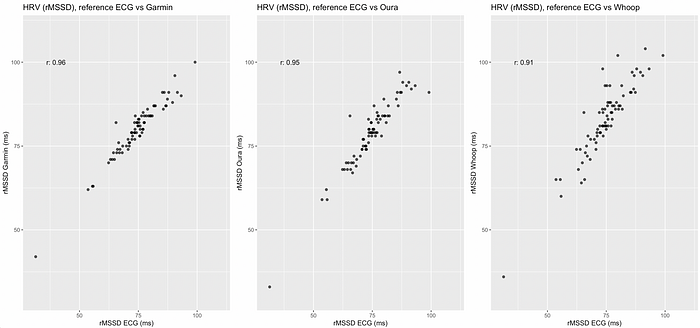
Correlations are pretty high (between 0.91 and 0.96, with 1.0 being a perfect correlation). This is somewhat helped by a sick day with very low HRV (extremes can fool this analysis). We can see again that Whoop’s data is a bit noisier (less of a straight line and with data points spread out quite a bit, especially on the higher end of the range). The data is decent overall, with Garmin looking very good, and Oura as well.
While we have no systematic errors for Oura and Garmin, Whoop seems to not only be noisier but also provide measurements with larger errors as HRV increases, something possibly to keep in mind for people with higher HRV (e.g. > 100ms). This analysis is more important, but still not really capturing how the data should be used.
3.3 relative changes over time
This is in my view the most important analysis, and possibly the only meaningful way to use HRV data. What I mean is that absolute values do not really tell us much: there is a huge overlap between the HRV distributions of people with dramatically different health and performance status. A regular person that never exercised might have the same HRV as an Olympian. Absolute HRV values carry very little information, due to a strong genetic component, and other aspects that are not well understood. While a low HRV is typically associated with poor health, there is no way that given an HRV measurement, we can determine a person’s health or athletic performance, as the distributions of absolute values are very wide and cover a large range of different individuals.
How do we use the data then? We look at relative changes, within individuals, in response to stressors.
For more information about this type of analysis, please refer to the blog below
To look at relative changes, in HRV4Training, and in the scientific literature, we use an approach in which part of the data is used to establish a so-called “normal range”.
The normal range is specific to you and continuously updates over time so that you always have a frame of reference to analyze your HRV data. There is no other meaningful way to look at changes in HRV, as otherwise, you would never know if e.g. a reduction in HRV is meaningful, or is simply part of day-to-day fluctuations typical of this parameter. If your software of choice does not provide you with a normal range, then it might be time to change the software.
Back to our analysis. Normally I would use 2 months of data to establish an ideal normal range. However, since I collected only ~3 months of data here, I used 1 month to determine the normal range, so that we have a bit more data to look at.
I have highlighted baseline changes and acute drops below the normal range in the figure below so that we can appreciate how the trends (baseline in blue) and acute changes are very similar:
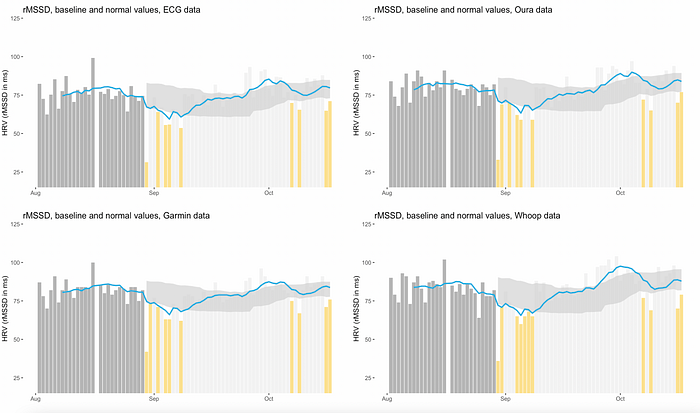
I will discuss more in detail what the highlighted suppressions mean, and what stressors they are associated with, but in the meantime, for context, the large drop after the initial phase used to determine the normal range (dark gray) is sickness, while the following series of low values, annotated in yellow, is due to the climate (heat). The increase in HRV, with the baseline (blue line) going above the normal range, is then likely due to cooling temperature and a high volume and intensity training block, with a few acute reductions due to poor sleep towards the end.
Given the data above, I would consider all devices reliable in detecting relative changes over time, which is the most important aspect to analyze in my view.
This analysis is never reported when comparing tools, and yet this is how the data is used in HRV4Training and in research, to capture responses and make adjustments.
3.4 acute stressors (sickness, heat, training)
Here we look in a bit more detail at the various stressors briefly mentioned earlier, so that we can better appreciate how the data is used, and how all the wearables were able to provide data that can highlight important physiological responses when properly contextualized with respect to my normal range.
Note that this is in no way the interpretation you get in any of their software, as I will discuss in the next section.
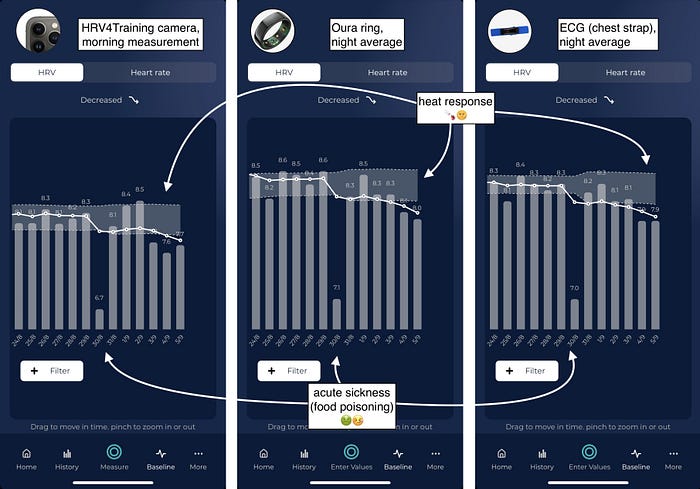
Sickness: food poisoning
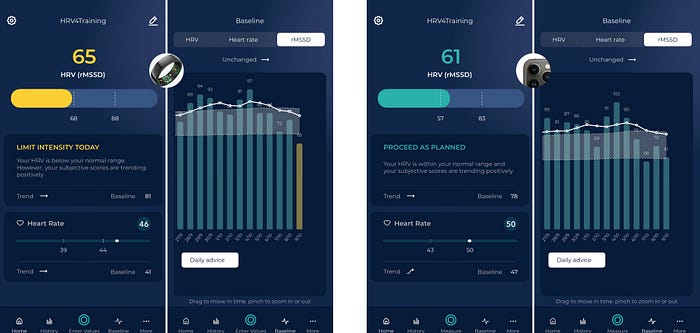
Here we have a large acute drop, captured very clearly as the HRV is far below the bottom end of the normal range, highlighted as a shaded area in the HRV4Training app.
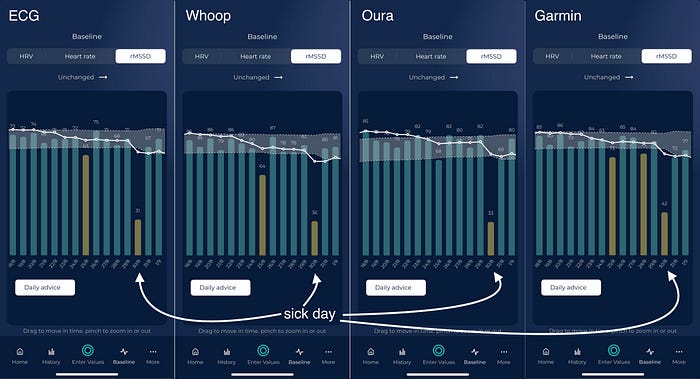
After about 10–12 hours, I started feeling better, and we can see that HRV re-normalizes very quickly, with only one day of suppression below the normal range.
Heat response: HRV suppression when changing environment
Environmental changes are one of the main drivers in changes in physiology, either due to seasonality (e.g. summer vs winter) or acute changes when facing e.g. heat or altitude. Here there is a bit more variation in the response, as this is a less acute stressor, but it is quite clear from all data streams, that I am dealing poorly with the change in the environment.
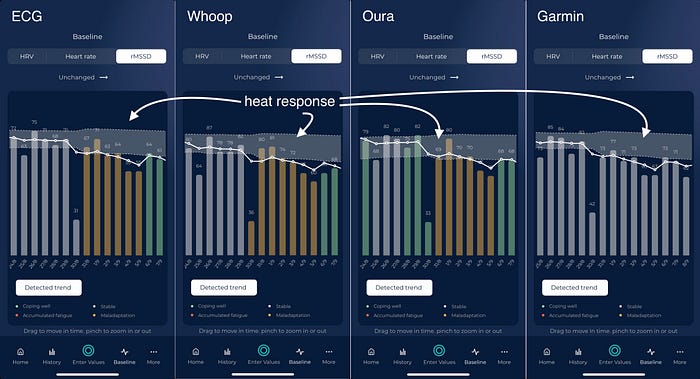
In the screenshots above I’ve colour-coded the data using HRV4Training’s trend detection, a feature that looks at how physiology (heart rate, HRV, and coefficient of variation of your HRV) has changed in the longer term, to detect your response. For Garmin, I did not have enough data yet as I started tracking later, and therefore there is no detected trend (about a month of data is required for this analysis).
Please see the blog below for more details on trends analysis in HRV4Training.
Heart Rate Variability (HRV) trends: going beyond daily scores
What resting heart rate and HRV can tell you in the longer term
Training
How does HRV change in response to training? It depends.
A common misconception is that HRV should decrease with increased training volume or intensity. However, this is definitely not how this works. In fact, it is all about your response. An acute response to increased volume and intensity, when responding well, is a stable or increasing HRV. This is what we have in the following phase, again captured well by all wearables.
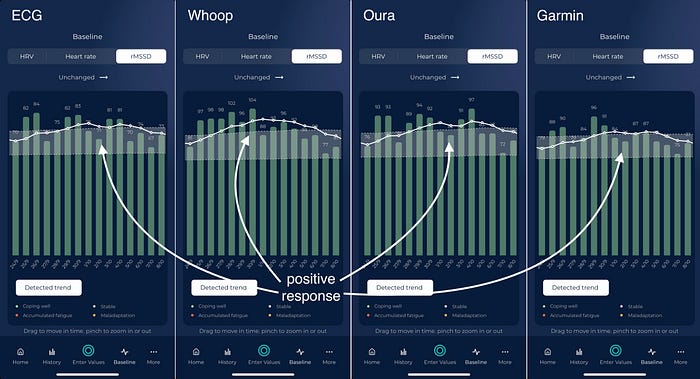
In the screenshots above I have again colour-coded the data based on HRV4Training’s detected trend, which shows I am coping well with training during these few weeks.
3.5 Data quality wrap-up
Based on the data reported here and published literature I believe you can collect decent data with any of these wearables.
Next, you need to interpret that data meaningfully, with respect to your normal range. Below I discuss how you can do so regardless of what you use, and what are the main limitations when using approaches typically available in the software provided with these sensors.
4. Issues with data interpretation
Here I want to try to keep my criticism broad and use this space to help you better understand why the typical interpretations provided together with these wearables are problematic. While these might be well-meaning companies, there are some common flaws in how the data is used.
My goal is to get you to think critically about the tools you are using and how the data is interpreted so that you can use the data more effectively:
- Some tools rely on the naive “higher is better”, interpreting a high HRV always as a good sign and a sign that you should be smashing it on a given day. This is not how physiology works.
- Some tools do not have a way to represent your normal range and to allow you to understand if a given daily change is irrelevant (a bit lower or higher than yesterday but within your normal range) or if it is a more meaningful change that should be taken differently.
- Some tools provide cumulative readiness or recovery scores, which give you the false impression that the score can better reflect your recovery or readiness since more data is aggregated, but in fact, confound how your body has responded to your behaviour, and make the data less useful.
Below I look at all of these problems in more detail.
4.1 higher is better is not how physiology works
Some tools rely on the naive “higher is better” interpretation when it comes to HRV. A high (or higher) HRV is always interpreted as a good sign and a sign that you should be going hard. This is not how physiology works. In fact, quite the contrary.
Even when looking at exercise data, an acute drop in heart rate often signals fatigue, despite the fact that a chronic reduction, over weeks or months, signals increased fitness. This is the case also for resting heart rate, and similarly, for HRV. A very high HRV can happen in situations in which your parasympathetic system is active not as a sign of readiness, but as an attempt to recover from a prior, large effort. Acute and chronic responses in physiology differ, and fatigue states can often resemble optimal states, but on a different time scale.
This is why it is nonsense to interpret HRV (or any other physiological signal) just in one direction: blood pressure, blood glucose, etc. — all have a normal range. Similarly, HRV has a normal range, which is specific to you, as I discuss below.
4.2 lack of a normal range: detecting meaningful changes
On top of the issue discussed above, HRV data has an inherently high day-to-day variability. This means that there can be large fluctuations between consecutive days, which is different from parameters that you might be more familiar with.
What are the implications? To make effective use of the data, we need to be able to determine what changes are trivial, or just part of normal day-to-day fluctuations, and what changes do matter and might require more attention or simply truly represent a positive (or negative) adaptation to training and other stressors.
Here is where pretty much any software out there fails. They show you a number for today, and you can look at your previous numbers, but then what? is my HRV lower because of a serious stressor or is it a bit lower just because of normal day-to-day variability? We need to determine (and show you) your normal range. This is something we have spent a lot of time researching and designing in HRV4Training, starting with the way the daily advice is built.
Software that interprets any HRV increase as a good sign, or any HRV decrease as a bad sign (or simply can’t even interpret the change for you), is failing to correctly represent the fact that there are normal variations in physiology, and that only variations outside of this normal range, should trigger concern or more attention or simply be interpreted as actual changes.
Using a normal range solves many problems at the same time, avoiding the pitfalls of the higher is better interpretations as well, since a particularly high score is also flagged as something to be cautious about.
4.3 issues with cumulative scores (readiness, recovery, etc.)
When providing daily advice (colour-coding and message) in HRV4Training we combine your physiology and your subjective feel (outputs). However, we do not use or include your behaviour, for example, your activity/training (input). This is a key difference from what you get in terms of readiness or recovery scores in wearables.
Why is that? The whole point of assessing your state, either objectively via heart rate variability (HRV) or subjectively by feel, is to determine how you responded to your given circumstances. You already know the input (behaviour) and are assessing the output (physiology or feel). In other words, if I train hard or more for a few days, I want to assess how I responded (output). Including activity (input) in my assessment would mean penalizing me regardless of my body’s response.
For athletes (of any level), this method is particularly ineffective: it hides information. If you train, there is no point looking at readiness or recovery scores to assess how you are responding to a given training stimulus as these scores confound your response with your behaviour. Is the score low because I responded poorly, or just because I did more? (check out this example here). This approach not only provides you with poor information about your actual response but fools you to believe the tool works. You go hard or do more, and they tell you you need to recover. In fact, you might be doing very well and be ready for another big training block.
This is not to say that your behaviour does not matter: it is a key context you can use to understand what could be driving changes. However, it should not be used to determine your response (output). You want to learn about the output of the system (physiological or subjective response) given the input (behaviour and other).
There are many nuances that are worth understanding a bit better if we want to make good use of available technology. Hopefully, this explains a bit why it is worth assessing your physiology and feel, while you can ignore most (all?) made-up scores.
Check out the blog and podcast below, for a more in-depth analysis of these aspects.
On Heart Rate Variability (HRV) and readiness
The goal of this post is to provide some clarity and general considerations on heart rate variability (HRV), readiness…
4.1 How to get a proper interpretation of your physiological data for any wearable
Given all the points above, we have designed HRV4Training to work differently from most tools out there.
In particular, data is always interpreted with respect to your normal range, which automatically solves two issues:
- an abnormally high value can be flagged as something to be more cautious about
- day to day differences (e.g. a value a bit lower or higher than yesterday) are easily put into context so that you know when a change is meaningful and when a change is just part of day-to-day variability and nothing to worry about
In the home screen of the app, you can easily see for example your daily HRV with respect to your weekly baseline and normal range (and also for heart rate). The normal ranges are built using the previous 2 months of data, and allow you to quickly understand your current physiological response.
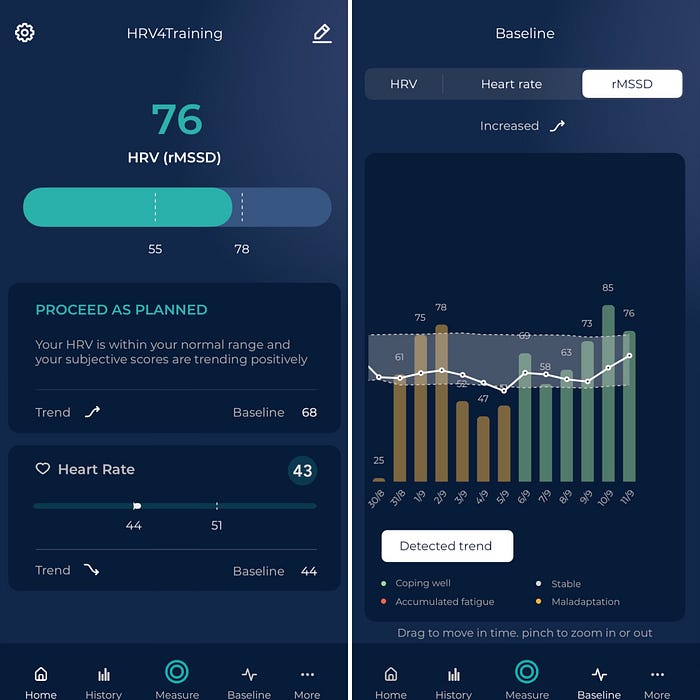
Simply put, HRV4Training is the only platform that provides you with an analysis of your physiology that matches how this data is used in state-of-the-art research and applied practice.
This means analyzing your resting physiology with respect to your normal range and providing you with feedback regarding your acute (daily) and chronic (weekly) physiological state, in response to the various stressors you face.
On top of this, the messaging (how the numbers are translated into words or advice), also accounts for how HRV should be used, combining outputs (physiology and feel) and not including inputs (behaviour).
There are many nuances that are worth understanding a bit better if we want to make good use of available technology. Hopefully, this explains why it is worth assessing your physiology and feel, while you can ignore made-up scores.
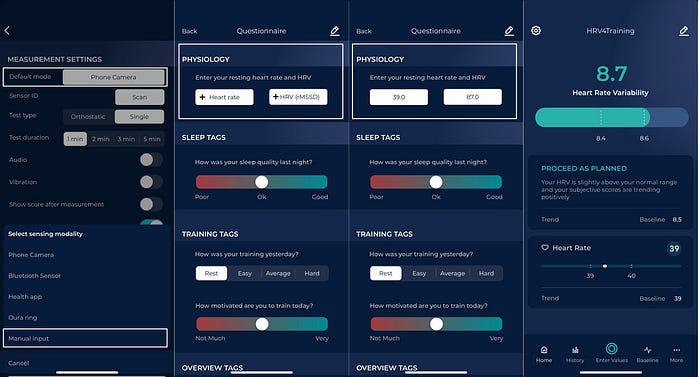
How to use HRV4Training’s interpretation with your wearable
The easiest way to track your night HRV in HRV4Training is to use Manual Input and enter it as part of the morning questionnaire, together with your subjective feel and other contextual data.
You can learn more here: https://www.hrv4training.com/blog/manual-input-in-hrv4training
If you are already using HRV4Training, before you go and buy a wearable, read the next section, as you most likely do not need one.
5. Comparison with morning data
Above I mentioned how morning and night data are the only two meaningful ways to capture baseline physiological stress levels. During the past months, I have (obviously) also collected morning HRV data, and here I will provide an overview of that data as well, and how it compares with night data. Some important points to reiterate:
- both morning and night data capture the same long-term changes in physiology
- both morning and night data capture the same response to strong, acute stressors (e.g. sickness)
- there can be differences in morning and night data based on a number of factors, typically measurement timing (the night comes earlier)
Let’s look at some data to back the statements above. First, we can look at the same acute stressors highlighted above for night data.
5.1 acute stressors (sickness, heat, training) and long-term changes
Here we can see the sick day, on the 30th of August, which caused the same acute suppression in morning data (left image), and night data.
We can also see the negative response to the heat, with HRV that is suppressed for several days after bouncing back from sickness. This was due to changing environment (travelling to a warmer country).
Both morning and night data provide the exact same information in this case.
Training
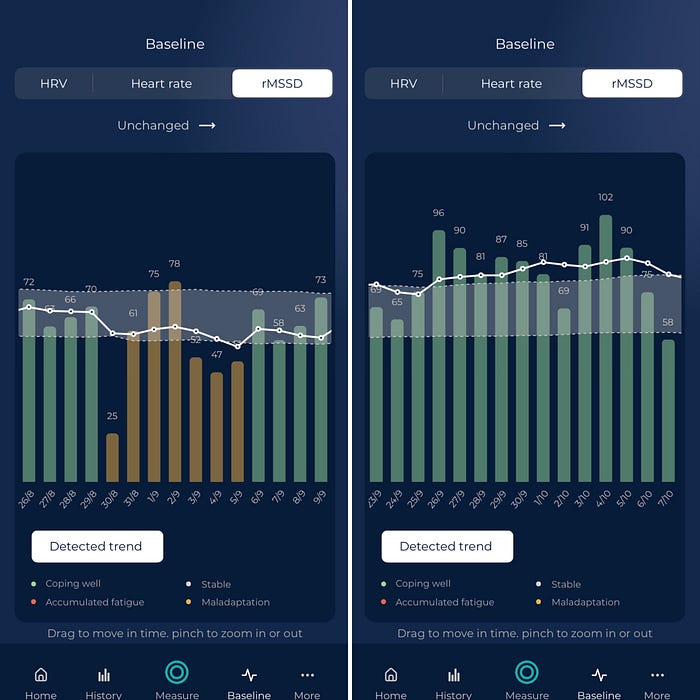
Below we can see in the first screenshot the negative response to the heat, together with HRV4Training’s trend detection, to highlight that not only do we have the same suppression seen in night data, but the various long-term physiological trends analyzed (resting heart rate, HRV, and the coefficient of variation of HRV) were also the same, since the same trend (maladaptation) has been detected.
In the second screenshot, we can see the positive response to increased training volume and intensity, which is also matching what I have reported above for night data.
Long-term physiological changes
Below I plotted all the data collected during the same period as I have shown for the ECG vs wearables comparison above.
Once again, we can see the same changes. I have used the first month of data to establish the normal range. I have again highlighted baseline changes and acute drops below the normal range in the figure so that we can appreciate how the trends (baseline in blue) and acute changes are very similar:
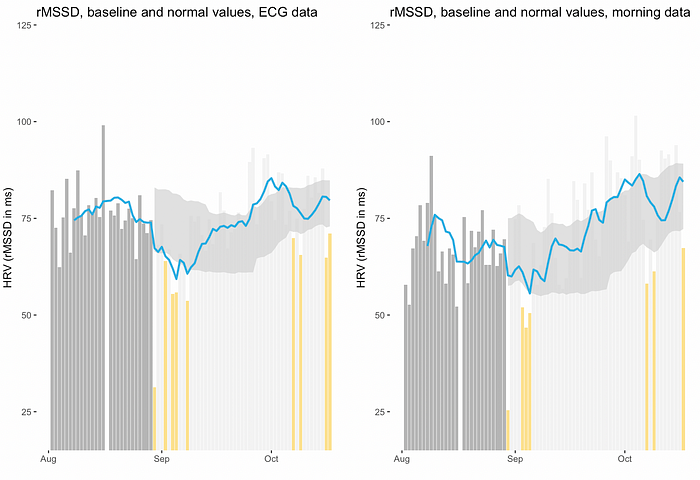
We can see for example the acute drop the first day in which the normal range is shown, then the few yellow days due to the heat response, and then an HRV that is increasing over weeks, before a few acute suppressions are again showing up, towards the end of the plot, possibly associated with poor sleep.
Overall, morning and night data are very well aligned over the entire period.
5.2 Differences between morning and night
In the previous high-level overview, we cannot appreciate some important differences between morning and night data, which I would like to briefly discuss here.
A typical difference in acute responses for morning and night data is due to large or late stressors, for example, a hard, long workout, followed by a late dinner. In these cases, often HRV is suppressed in the first part of the night, causing a low average, but back within normal range by the morning. Here is an example:
Looking at night data, in the first half of the night we have: HRV = 61 ms, heart rate = 49 bpm, while in the second part of the night: HRV = 69 ms, heart rate = 44 bpm, which shows how in the second part of the night physiology is back within normal range, just like in the morning.
Large but not too large acute stressors are the ones where we can find these differences (very large stressors like sickness would cause long-lasting suppressions, as we have previously seen).
This is not to say that one measurement is better than the other, but simply to highlight that there are differences, and these differences have implications for how the data is used.
For more considerations about the differences between morning and night data, see my blog below
Thoughts on Heart Rate Variability (HRV) measurement timing: morning or night?
Earlier today I was reviewing a journal paper looking at morning and night heart rate variability (HRV), a topic I have…
5.3 Do you need a wearable?
Based on all of the above, it should be clear that you can capture acute and long-term stress responses either in the morning or at night.
Hence, my recommendation when someone is interested in measuring their resting physiology is the following: pick a sensor and routine that works for you.
If you prefer to wear something overnight, by all means, get a device that does so. If you prefer not to wear something during the night, charge it, etc. and have a morning routine that allows you to take 1 minute to measure your resting physiology, then go that way. If you are not sure this is for you, you can use your phone camera and invest as little as 10$ in measuring your physiology daily and accurately.
There is no clear advantage in using one method or the other, however, there can be some differences based on stressors’ timing and other aspects that I discuss in-depth in this blog post. Make sure you understand these differences before picking one.
Personally, now that I am done with this experiment, I will keep measuring in the morning while sitting and also collect night data using the Oura ring. Among the wearables, I trust Oura more in terms of data quality and also find the ring more comfortable at night, since it does not need to be worn tight like other wrist-based wearables.
In terms of actionability, I normally rely on the morning measurement, as it provides a better assessment of my readiness for the day, while I keep an eye on night data as an assessment of the previous day’s behaviour. As shown in this blog, on most occasions the two are well aligned.
6. Conclusions
In this blog, I’ve looked at night HRV data from some of the most commonly used wearables, showing how all of these sensors are pretty good at capturing changes in resting physiology in response to different stressors, despite some differences in absolute values with respect to reference ECG.
Despite the accuracy, the way the data is used in the software provided with these sensors is often unable to account for some of the most important issues: naive interpretations (higher is better), lack of a normal range (what’s a meaningful change?), and confounding your physiological response with your behaviour, are all common issues that limit the utility of the data. I have covered how we address these issues in HRV4Training so that the data is more meaningful and actionable.
Finally, I’ve also compared night data from these wearables with morning data, showing how both time points are able to capture the same responses, with potential differences based on stressor timing.
Reader-Powered Content
 This content is not sponsored. It’s mostly me behind the labour of love which is this site and I appreciate everyone who follows, subscribes or Buys Me A Coffee ❤️ Alternatively please buy the reviewed product from my partners. Thank you! FTC: Affiliate Disclosure: Links pay commission. As an Amazon Associate, I earn from qualifying purchases.
![]()
The newest Garmins that read night HRV also show you what is considered the normal range, HRV4Training it’s not the only plataform the does that. Anyway, very useful post, good to have all this info together.
Very comprehensive post.
I have an emfit and it seems hands down the best way to measure and track HRV but I wish I could get the data from it into something else, their data view is a bit simple and dated looking.
I agree it’s a very good way. simply also wearing a ring only at night like Oura is also easy and unobtrusive.
yes their dashboard now looks a bit dated but it has some pretty good insights o on it.
you can do some links (from memory) the high-level stuff can be sent to training peaks and a few other platforms. i think you can manually export as well?
what would you want to export and why?
Tfk , amazing , I think , not being crazy here, this is one of the best Post if not the best post about HRV , devices and data ever done, why? it contains so many links , references , points and resume of those that is perfect for someone like me (who knows and har read most of the HRV literature out there) but I miss the device test vs device test.
One thing, are you dropping whoop for Oura? only for sleep? I’m currently using it , and I won’t drop for Oura cause I want 24/7 HR, I don’t like wear rings and I wear mechanical watch while not training. Perhaps the reason of Oura accuracy is that Marco Altini is involved in the project.
Thanks a lot for this post, I am sure took you a lot of thought to organize it, awesome!
I think you can thank Mr Altini 😉
anyway, to answer your question. I’m not dropping whoop for oura, in the sense that I regularly use 4 recovery methods for each night! currently its oura, garmin, polar h10 (HRV4training) and apple watch. I’ll be swapping the whoop strap in soon, no doubt. but that’s just for running this blog. for me personally were io not doing this blog i guess i might use oura or emfit (my partner is currently using mine) just because of the convenience factor. I would probably be more inclined to use Apple Watch than Garmin as I trust the accuracy of the former more.
Yeah makes sense , to run the blog makes absolutely sense. I wish to be honest apple or Garmin would do something like whoop, I like whoop but I prefer one platform for all. To be honest hrv4training was the best thing , but having to take a measurement every morning in the same exact position was not ideal for me .
apple won’t do recovery at least for a little while
look at athlytic or training today apps on apple
I just want slick no screen device that is not a ring , whoop is really good I just want more from them , apple and Garmin are both fine , just don’t like to wear smartwatch while not training , I have them all.
biostrap is good https://the5krunner.com/2019/03/01/biostrap-review/
not sure why you don’t think a ring is ok to wear only at night?
Perhaps I haven’t explain myself correctly :-). I believe sleeping with the ring would be great, but I want 24/7 heart rate and I don’t like to wear rings. I like whoop strain system , I think is quite accurate , it represents well my heart stress over the course of a day, I am, like many, always looking for the most accurate device. So I could add the Oura , but I would be Training with a 955 , wearing as well whoop and whoop the rest of the day and then sleeping with Oura. is a little bit not ideal 🙂 , So I wish Garmin for example would have a device that I can wear like whoop or biotstrap (no screen, little more slick please) while not training and sleeping , and then, the 955 while training, In order get a good picture of my heart , HRV , pulseOX , temperature, rest rate, etc etc.
Is too much to ask 🙂 ? perhaps it is
vivosmart 4 maybe.
Thank you for this useful und very detailed article!
I‘m a Oura/HRV4T-User since 2 years and fine with that in general. The only thing I ‚hate‘ ist the complexity of my app- and portal-environment! In summary I need 7 apps to manage my training and the big picture is only inside my head. So I think about going back to Garmin just to avoid this problem. Once I left them because of the useless data they delivered. Do you think Garmin made their improvement steps well and it is worth it to give them another try?
no 😉
your piecemeal approach to data/information/insight collection sounds like mine.
i think if you can eliminate optical hr entirely from your sources then things should be better for you.
I feel your pain
This is a nice comprehensive post.
I tried using my scosche rhythm24 with HRV4Training each morning before my morning run. I found it too cumbersome, time consuming and simply didn’t really help with training. Measuring during sleep seems the way to go.
agreed.
but you really should do the waking reading before even getting out of bed. to minimise changes in activity/environmental variables.
i used to doo al this more than a decade ago with an android phone and flakey Bluetooth connection. when you add up the 5 minutes of fumbed re-readings and readings each morning for a couple of years the resulting number of DAYS is quite disconcerting. I stopped doing it (admittedly I’ve started again but 2 minutes with a reliable bluetooth iPhone isn’t too bad)
I have an Oura ring + Garmin forerunner 255, and find that the HRV of the Oura ring is much higher than the Garmin device, between 20-40 ms off. I wear the ring and watch on the left hand, with the Oura usually on the index finger. I tried wearing the Oura on the ring finger for one night but this didn’t change the difference. Whilst the Oura gave me an HRV reading of 147, 92, 144 in the last three days, Garmin gave me 99, 66, 86. Although the overnight trends are of a similar patter, I can’t help but wonder – where the difference can be coming from? Could it be that some of my arm hair is obscuring the sensor?
IDK Dave and I get the same sort of discrepancies between all the tech i wear at night. oura, garmin, whoop, Polar H10 and apple watch
FYI: you should wear the device in the exact same place each time.
some of the readings from the devices I state determine hrv from different periods, so that is one area of confusion.
much of the HRV differences come down the the signal processing algorithms. The subsequent HRV algorithms, like 20*LnrMSSD are all fairly similar from brand to brand.
However for you and for me, the bottom line is that the interpretations made from any device should be comparable to the interpretations made by another device (on readiness and sleep quality/sleep stage). of course…it might NOT be the same !